INVITE-ONLY SCRIPT
更新済 [VIP] ABCD Pattern
DESCRIPTION
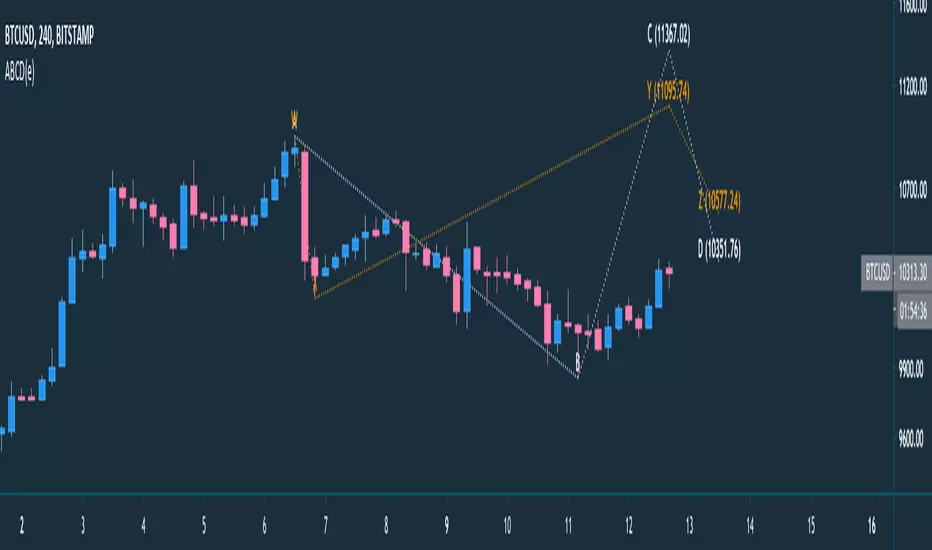
The AB=CD pattern is one of the most popular harmonic chart patterns.
Buy and sell signals are generated after the final C-to-D leg, when a reversal is expected to occur.
If the pattern is trending higher, you can look to sell or enter a short position at Point D.
If the pattern is trending lower, you can look to buy the security at Point D in anticipation of a turnaround.
Stop-loss points are best placed just above or below Point D, depending on the direction of the trade.
If the move extends beyond that point, the chart pattern is invalidated and the reversal is less likely to occur.
Take-profit points are typically placed using Fibonacci levels.
For example, you might look for a move back to the original Point A and move a trailing stop-loss to 28.2%, 50% and 61.8% Fibonacci levels along the way.
The AB=CD chart pattern works best when combined with other technical indicators or chart patterns, such as the relative strength index (RSI) or pivot points.
You may also want to use volume as a confirmation of a reversal once the AB=CD chart pattern makes a prediction.
CONFIGURATION
Please check link below for but report, trial and join with community
The AB=CD pattern is one of the most popular harmonic chart patterns.
Buy and sell signals are generated after the final C-to-D leg, when a reversal is expected to occur.
If the pattern is trending higher, you can look to sell or enter a short position at Point D.
If the pattern is trending lower, you can look to buy the security at Point D in anticipation of a turnaround.
Stop-loss points are best placed just above or below Point D, depending on the direction of the trade.
If the move extends beyond that point, the chart pattern is invalidated and the reversal is less likely to occur.
Take-profit points are typically placed using Fibonacci levels.
For example, you might look for a move back to the original Point A and move a trailing stop-loss to 28.2%, 50% and 61.8% Fibonacci levels along the way.
The AB=CD chart pattern works best when combined with other technical indicators or chart patterns, such as the relative strength index (RSI) or pivot points.
You may also want to use volume as a confirmation of a reversal once the AB=CD chart pattern makes a prediction.
CONFIGURATION
- Strategy ABCD :
- AB=CD : Leg AB is equal to leg CD
- Ratio : Formula to get leg CD by (AB/0.618) x 1.272 but if
- Forecast : is the continuity of ratio abcd, it is called ABCDE - Different between ABCD vs WXYZ, ABCD is harmonic pattern based on latest chart, but WXYZ based on previous preiodic
- Label style : Balloon will show with comment box, but Text just a simple character without comment shape
- Line style : default is dotted, available values are dashed, solid and dotted
- Colour : change line colour for line and text
- Show label : Display or hide label
Please check link below for but report, trial and join with community
リリースノート
Update C and D tags Labelsリリースノート
bugfix calculationリリースノート
Added forecast ab=cdFixed line CD issue on forecast
Fixed monthly chart issue
招待専用スクリプト
このスクリプトは作者が承認したユーザーのみアクセス可能です。使用するにはアクセス申請をして許可を得る必要があります。通常は支払い後に承認されます。詳細は下記の作者の指示に従うか、deSultanTMに直接お問い合わせください。
TradingViewは、作者を完全に信頼し、スクリプトの動作を理解していない限り、有料スクリプトの購入・使用を推奨しません。コミュニティスクリプトには無料のオープンソースの代替が多数あります。
作者の指示
免責事項
この情報および投稿は、TradingViewが提供または推奨する金融、投資、トレード、その他のアドバイスや推奨を意図するものではなく、それらを構成するものでもありません。詳細は利用規約をご覧ください。