INVITE-ONLY SCRIPT
MACD CFF Edition
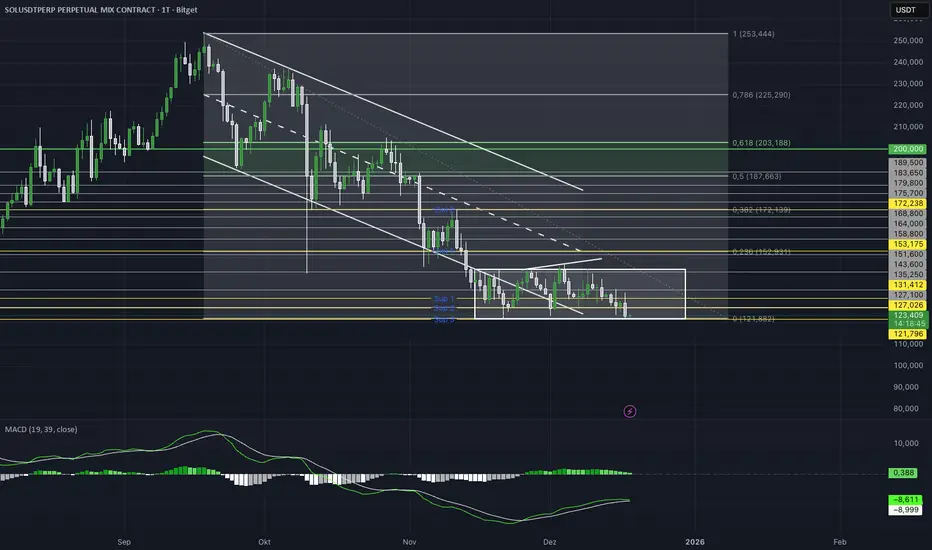
MACD (19 / 39) – Higher Timeframe Momentum
This indicator is a modified MACD version designed specifically for higher timeframes and structural market moves.
Compared to the standard MACD (12 / 26), the periods are intentionally extended to reduce short-term noise and focus on meaningful momentum and trend shifts.
The classic MACD (12 / 26) reacts very quickly and often produces many signals on lower and mid timeframes that mainly reflect micro-volatility.
Using 19 / 39 deliberately slows the indicator down and filters out movements that lack relevance for higher-timeframe market structure.
Line Explanation
White Line – MACD Line (19–39)
This line measures the distance between short-term and mid-term momentum.
It highlights structural changes in capital flow.
Above zero → bullish structural momentum
Below zero → bearish structural momentum
Green Line – Signal Line
A smoothed version of the MACD line.
Used for confirmation, not for fast entry signals.
Crossovers should be interpreted as context confirmation, not buy or sell commands.
Histogram
Displays the distance between the MACD line and the signal line.
Helps identify whether momentum is:
expanding
or weakening
Intended Use
• Best suited for 4H, Daily and Weekly
• Trend and directional bias filter
• Structural confirmation
• Works best combined with price action and key levels
Not a scalping tool. Not a standalone signal indicator.
招待専用スクリプト
このスクリプトは作者が承認したユーザーのみアクセス可能です。使用するにはアクセス申請をして許可を得る必要があります。通常は支払い後に承認されます。詳細は下記の作者の指示に従うか、michlRicoに直接お問い合わせください。
TradingViewは、作者を完全に信頼し、スクリプトの動作を理解していない限り、有料スクリプトの購入・使用を推奨しません。コミュニティスクリプトには無料のオープンソースの代替が多数あります。
作者の指示
Schreiben sie mir auf Coinflowfinance !
免責事項
この情報および投稿は、TradingViewが提供または推奨する金融、投資、トレード、その他のアドバイスや推奨を意図するものではなく、それらを構成するものでもありません。詳細は利用規約をご覧ください。