PROTECTED SOURCE SCRIPT
Multi Fixed MA
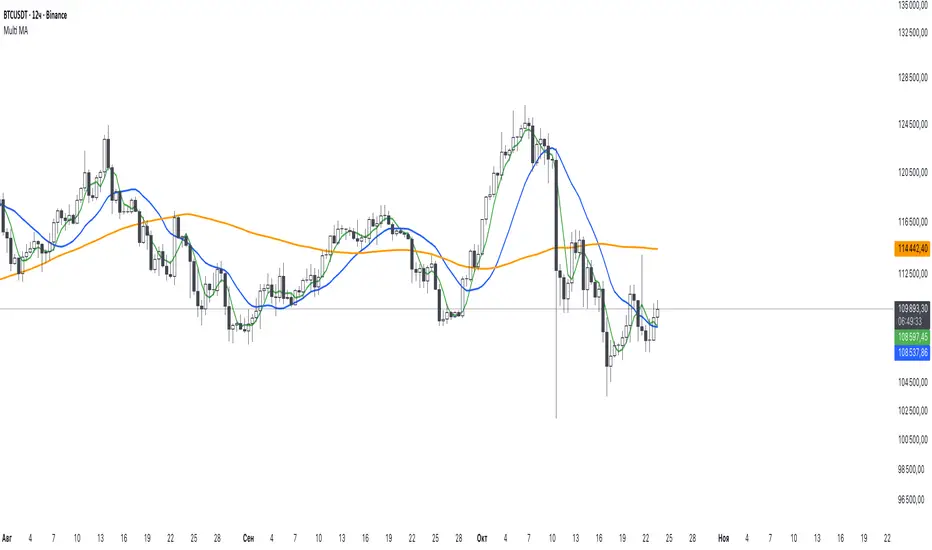
Multi Fixed MA Indicator
This Pine Script indicator displays up to three customizable Moving Averages (MAs) on the chart, allowing users to analyze price trends across different timeframes. Each MA can be independently configured for type, length, timeframe, and colors for bullish and bearish slopes.
Features:
MA Types: Choose from Simple (SMA), Exponential (EMA), Weighted (WMA), or Linear Regression (Linear) MAs.
Customizable Timeframes: Select from a range of timeframes (1min to 1M) for each MA.
Show/Hide MAs: Enable or disable each of the three MAs via checkboxes.
Dynamic Coloring: Each MA changes color based on its slope (bullish or bearish), with user-defined bull and bear colors.
Flexible Lengths: Set individual lengths for each MA.
Usage:
Configure the MA type, length, and timeframe for each of the three MAs.
Toggle visibility for each MA using the "Show" checkboxes.
Customize bull and bear colors for each MA to visually distinguish trends.
The indicator plots MAs on the chart, with colors reflecting whether the current MA value is higher (bullish) or lower (bearish) than the previous value, maintaining the prior color when equal.
Ideal for traders analyzing trends across multiple timeframes with tailored visual cues.
保護スクリプト
このスクリプトのソースコードは非公開で投稿されています。 ただし、制限なく自由に使用できます – 詳細はこちらでご確認ください。
免責事項
この情報および投稿は、TradingViewが提供または推奨する金融、投資、トレード、その他のアドバイスや推奨を意図するものではなく、それらを構成するものでもありません。詳細は利用規約をご覧ください。
保護スクリプト
このスクリプトのソースコードは非公開で投稿されています。 ただし、制限なく自由に使用できます – 詳細はこちらでご確認ください。
免責事項
この情報および投稿は、TradingViewが提供または推奨する金融、投資、トレード、その他のアドバイスや推奨を意図するものではなく、それらを構成するものでもありません。詳細は利用規約をご覧ください。