PROTECTED SOURCE SCRIPT
Ori Volume Profile
Ori Volume Profile plots trading volume as a histogram on the price scale.
You can add it more than once to increase its precision.
It starts drawing from the bar it starts to calculate.
If you can't see the volume profile zoom out and go left in the chart until you can see the starting position.
For adding it multiple times you should set inputs correclty. For example if you want to add it 3 times, total indicator amount should be 3 in all of the 3 indicator and you should enumerate their order of the current amount. First indicators order should be 1, second indicators order should be 2, third indicators order should be 3 etc
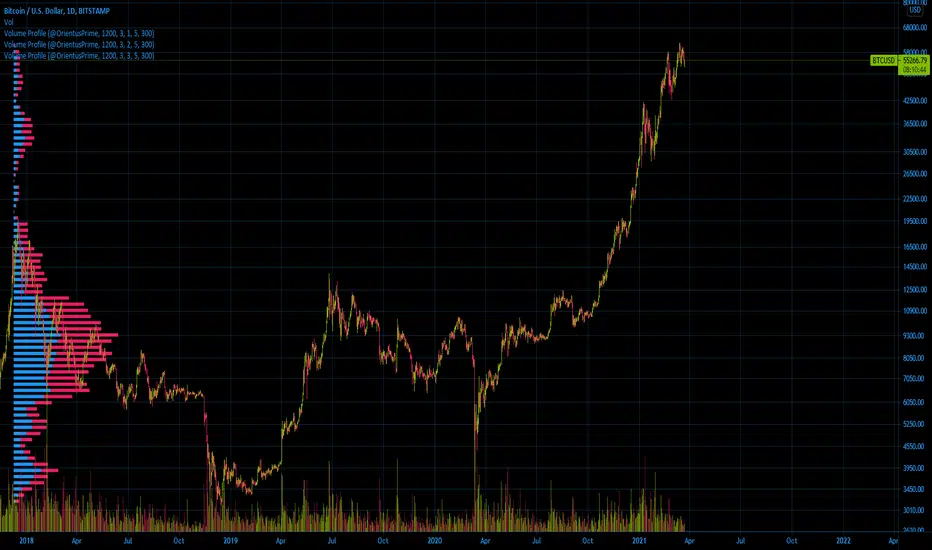
Settings for the one in the image:
Firs indicator: 1200 3 1 5 300
Second indicator:1200 3 2 5 300
Third indicator:1200 3 3 5 300
You can add it more than once to increase its precision.
It starts drawing from the bar it starts to calculate.
If you can't see the volume profile zoom out and go left in the chart until you can see the starting position.
For adding it multiple times you should set inputs correclty. For example if you want to add it 3 times, total indicator amount should be 3 in all of the 3 indicator and you should enumerate their order of the current amount. First indicators order should be 1, second indicators order should be 2, third indicators order should be 3 etc
Settings for the one in the image:
Firs indicator: 1200 3 1 5 300
Second indicator:1200 3 2 5 300
Third indicator:1200 3 3 5 300
保護スクリプト
このスクリプトのソースコードは非公開で投稿されています。 ただし、制限なく自由に使用できます – 詳細はこちらでご確認ください。
免責事項
この情報および投稿は、TradingViewが提供または推奨する金融、投資、トレード、その他のアドバイスや推奨を意図するものではなく、それらを構成するものでもありません。詳細は利用規約をご覧ください。
保護スクリプト
このスクリプトのソースコードは非公開で投稿されています。 ただし、制限なく自由に使用できます – 詳細はこちらでご確認ください。
免責事項
この情報および投稿は、TradingViewが提供または推奨する金融、投資、トレード、その他のアドバイスや推奨を意図するものではなく、それらを構成するものでもありません。詳細は利用規約をご覧ください。