INVITE-ONLY SCRIPT
更新済 GapUp and GapDown with Candle [MV]
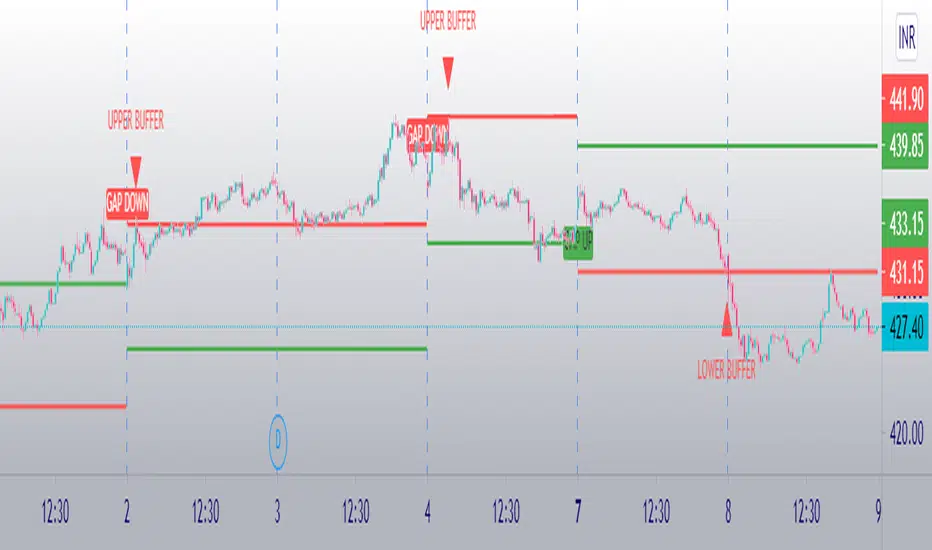
This Indicator Session Time is Indian NSE and BSE Equity Market
How to work This Indicator?
1. Buy plot When Market Gap Down and First Candle is Red (Close < Open).
2. Sell plot When Market Gap Up and First Candle is Green (Close > Open).
Note: This Indicator Repainted you Can also avoid Choose Once Per Bar Close in Alerts
If You Have Any Suggestion Please Mention There.
Below one image From Buy-side
リリースノート
Now You Can Add GapUp and GapDown % Condition By default 0 Percentage. Calculate By GapUp and GapDown Percentage Previous Day Close Price.リリースノート
indicator fully updated now its working with Gap up or Gap downTake profit and stoploss also available with alerts
more update comming soon
招待専用スクリプト
このスクリプトは作者が承認したユーザーのみアクセス可能です。使用するにはアクセス申請をして許可を得る必要があります。通常は支払い後に承認されます。詳細は下記の作者の指示に従うか、Manoj-vermaに直接お問い合わせください。
TradingViewは、作者を完全に信頼し、スクリプトの動作を理解していない限り、有料スクリプトの購入・使用を推奨しません。コミュニティスクリプトには無料のオープンソースの代替が多数あります。
作者の指示
Important: This Indicator we are using for Automation Trading if You Want This Indicator Access, Please Contact me PM on Tradingview
Questions to ask for subject access request responses, suggestions You Can Reach Out to me Using Below
Tradingview: tradingview.com/u/Manoj-verma/
Telegram ID: t.me/MVyoutube
Tradingview: tradingview.com/u/Manoj-verma/
Telegram ID: t.me/MVyoutube
免責事項
この情報および投稿は、TradingViewが提供または推奨する金融、投資、トレード、その他のアドバイスや推奨を意図するものではなく、それらを構成するものでもありません。詳細は利用規約をご覧ください。