PROTECTED SOURCE SCRIPT
更新済 Support and Resistance Dynamic
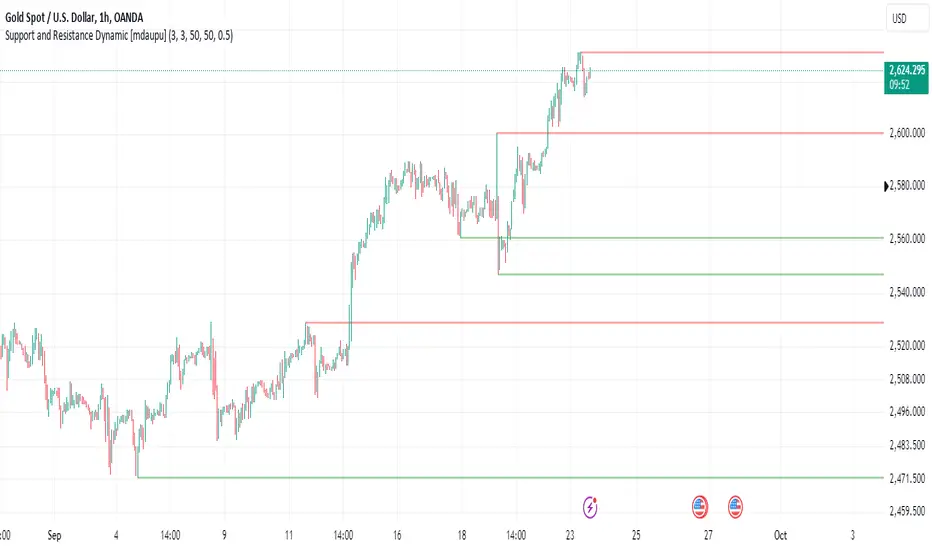
This indicator is designed to plot horizontal lines on significant Support and Resistance based on custom user-defined lookback periods. It helps traders identify key levels of support and resistance, improving their ability to detect potential trend reversals or breakout zones.
Key Features:
1. Custom Number of Support and Resistance Lines:
- The script allows users to independently control the number of horizontal lines for Support and Resistance, helping to focus on the most important levels.
2. Adjustable Lookback Period
- Customize the lookback periods for detecting support and resistance, giving you the flexibility to capture different swing points in various market conditions.
3. Minimum Difference Filter:
- The script includes a customizable minimum difference percentage filter to ensure only significant pivots are plotted, avoiding clutter and focusing on more meaningful levels.
4. Automatic Line Extension:
- Pivot high and low lines automatically extend to the right, clearly marking key levels until they are broken or surpassed by price action.
This tool is ideal for technical traders who rely on support and resistance zones for making trading decisions. Whether you are swing trading, day trading, or scalping, these key levels can help enhance your chart analysis.
How to Use:
- Customize the number of support and resistance lines to suit your strategy.
- Adjust the lookback settings to match your timeframe or market conditions.
- Fine-tune the minimum difference percentage to filter out noise and focus on stronger support and resistance.
This script provides a dynamic and customizable way to visualize support and resistance, helping you spot key turning points and make informed trading decisions.
リリースノート
This indicator is designed to plot horizontal lines on significant Support and Resistance based on custom user-defined lookback periods. It helps traders identify key levels of support and resistance, improving their ability to detect potential trend reversals or breakout zones.Key Features:
1. Custom Number of Support and Resistance Lines:
- The script allows users to independently control the number of horizontal lines for Support and Resistance, helping to focus on the most important levels.
2. Adjustable Lookback Period
- Customize the lookback periods for detecting support and resistance, giving you the flexibility to capture different swing points in various market conditions.
3. Minimum Difference Filter:
- The script includes a customizable minimum difference percentage filter to ensure only significant pivots are plotted, avoiding clutter and focusing on more meaningful levels.
4. Automatic Line Extension:
- Pivot high and low lines automatically extend to the right, clearly marking key levels until they are broken or surpassed by price action.
This tool is ideal for technical traders who rely on support and resistance zones for making trading decisions. Whether you are swing trading, day trading, or scalping, these key levels can help enhance your chart analysis.
How to Use:
- Customize the number of support and resistance lines to suit your strategy.
- Adjust the lookback settings to match your timeframe or market conditions.
- Fine-tune the minimum difference percentage to filter out noise and focus on stronger support and resistance.
This script provides a dynamic and customizable way to visualize support and resistance, helping you spot key turning points and make informed trading decisions.
リリースノート
Some conditions are updated保護スクリプト
このスクリプトのソースコードは非公開で投稿されています。 ただし、制限なく自由に使用できます – 詳細はこちらでご確認ください。
免責事項
この情報および投稿は、TradingViewが提供または推奨する金融、投資、トレード、その他のアドバイスや推奨を意図するものではなく、それらを構成するものでもありません。詳細は利用規約をご覧ください。
免責事項
この情報および投稿は、TradingViewが提供または推奨する金融、投資、トレード、その他のアドバイスや推奨を意図するものではなく、それらを構成するものでもありません。詳細は利用規約をご覧ください。