OPEN-SOURCE SCRIPT
更新済 BB Support & Resistance
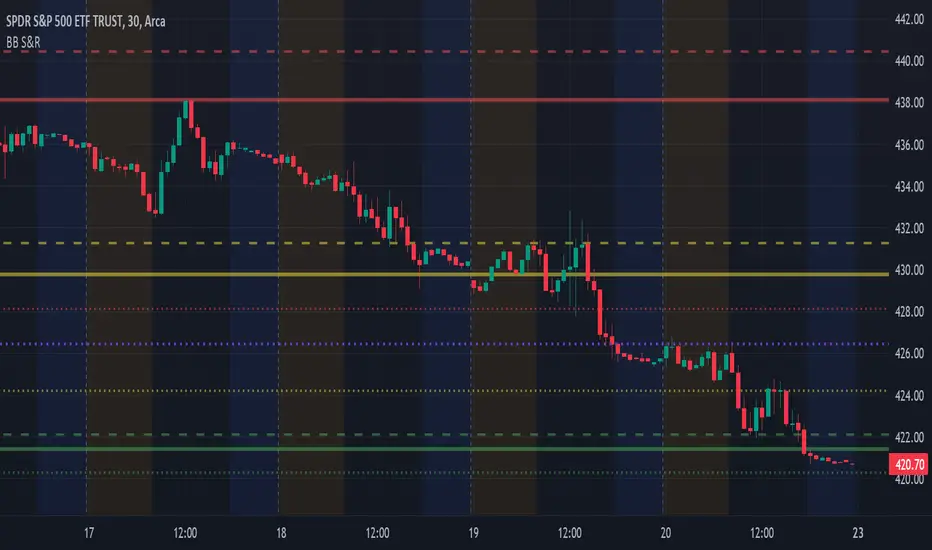
Choosing support and resistance can be time consuming and subjective. Personally, I don't want to spend too much time manually marking up charts. Credit to video I saw, forget the producer, that demonstrated how multi-time frame Bollinger Bands can act as support and resistance. I suggest reading up on Bollinger Bands (en.wikipedia.org/wiki/Bollinger_Bands) and how to trade them. This indicator draws support and resistance lines based on Bollinger Bands on three time frames. You can select 1 or all three time frames to display on your chart. Enjoy.
リリースノート
Choosing support and resistance can be time consuming and subjective. Personally, I don't want to spend too much time manually marking up charts. Credit to video I saw, forget the producer, that demonstrated how multi-time frame Bollinger Bands can act as support and resistance. I suggest reading up on Bollinger Bands (en.wikipedia.org/wiki/Bollinger Bands) and how to use them in your trading. This indicator draws support and resistance lines based on Bollinger Bands on three time frames. You can select 1 or all three time frames to display on your chart. Enjoy.Updated...Added option to set S&R line colors by time frame.
オープンソーススクリプト
TradingViewの精神に則り、このスクリプトの作者はコードをオープンソースとして公開してくれました。トレーダーが内容を確認・検証できるようにという配慮です。作者に拍手を送りましょう!無料で利用できますが、コードの再公開はハウスルールに従う必要があります。
免責事項
この情報および投稿は、TradingViewが提供または推奨する金融、投資、トレード、その他のアドバイスや推奨を意図するものではなく、それらを構成するものでもありません。詳細は利用規約をご覧ください。
オープンソーススクリプト
TradingViewの精神に則り、このスクリプトの作者はコードをオープンソースとして公開してくれました。トレーダーが内容を確認・検証できるようにという配慮です。作者に拍手を送りましょう!無料で利用できますが、コードの再公開はハウスルールに従う必要があります。
免責事項
この情報および投稿は、TradingViewが提供または推奨する金融、投資、トレード、その他のアドバイスや推奨を意図するものではなく、それらを構成するものでもありません。詳細は利用規約をご覧ください。