PROTECTED SOURCE SCRIPT
Sumon Pal Volume Osc

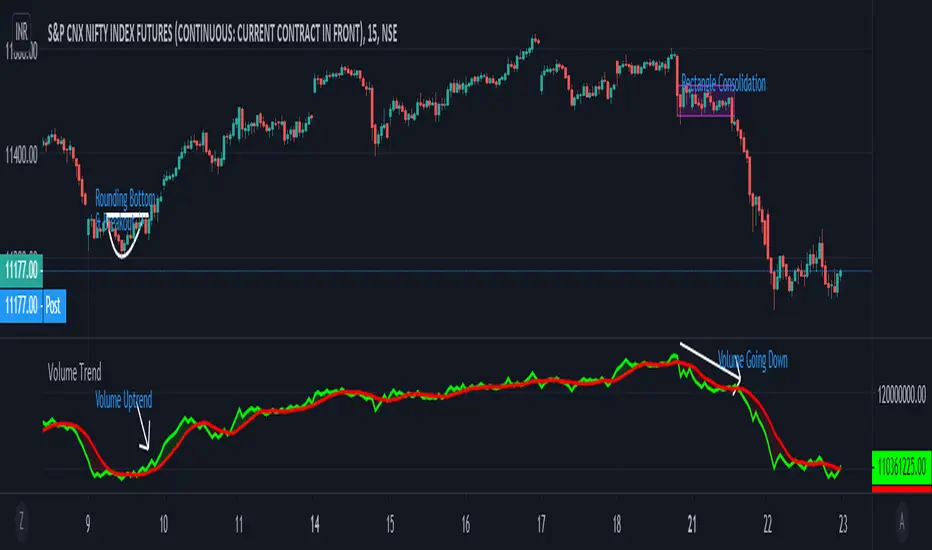
This is a volume oscillator calculated by the volume action on each bar price movement over a period of time.
When the short term volume(green line) is above the long term volume line(red)it indicates volume is coming and buying pressure may be observed.
Similarly when the short term volume is below the long term, volume is getting liquidated and selling pressure may be observed.
This indicator alone can't be used for buying or selling decision. This indicator can be used along with price action break out or break down level to get an idea whether volume is supporting the break out/down or not.
Disclaimer: Backtest this indicator with price action over a period of time and understand how it works before taking any trading decision. Trading in equity is always risky. Asses your risk profile and trade by managing proper risk.
保護スクリプト
このスクリプトのソースコードは非公開で投稿されています。 ただし、制限なく自由に使用できます – 詳細はこちらでご確認ください。
免責事項
この情報および投稿は、TradingViewが提供または推奨する金融、投資、トレード、その他のアドバイスや推奨を意図するものではなく、それらを構成するものでもありません。詳細は利用規約をご覧ください。
保護スクリプト
このスクリプトのソースコードは非公開で投稿されています。 ただし、制限なく自由に使用できます – 詳細はこちらでご確認ください。
免責事項
この情報および投稿は、TradingViewが提供または推奨する金融、投資、トレード、その他のアドバイスや推奨を意図するものではなく、それらを構成するものでもありません。詳細は利用規約をご覧ください。