INVITE-ONLY SCRIPT
Bull-Bear Pressure
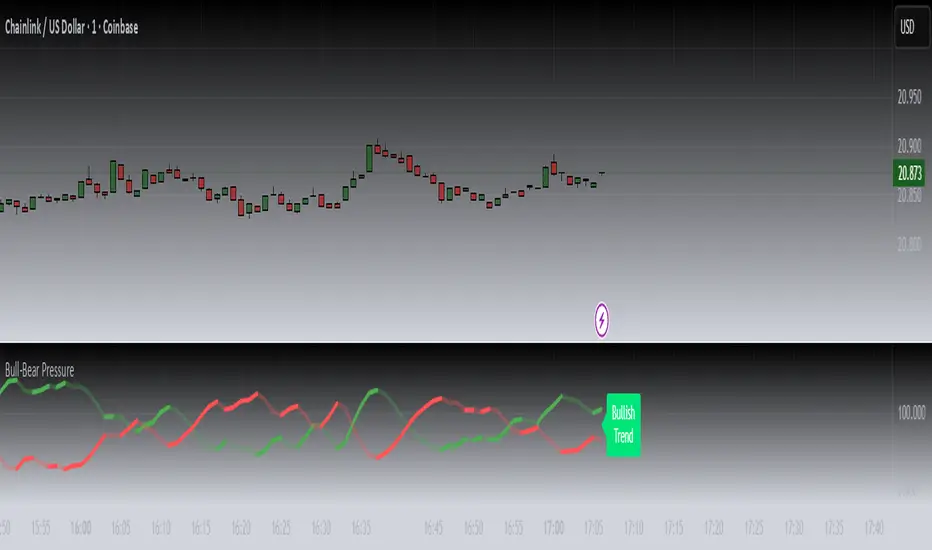
BULL-BEAR PRESSURE
Uniqueness
Bull-Bear Pressure measures the live tug-of-war between bullish and bearish momentum by transforming internal engine data into a visual gauge of market pressure.
How It Works
The indicator processes dual data feeds — one representing bullish pressure and the other bearish pressure. These values update in real time showing how pressure dynamics are currently distributed and highlighting areas where momentum dynamics may be adjusting.
Usefulness
By monitoring pressure dynamics, traders gain context on whether moves are supported by strong participation or fading momentum. It adds depth to directional bias especially when viewing multiple timeframe charts side by side.
How to Use It
Overlay Bull-Bear Pressure on your chart and compare shifts in bullish vs bearish strength. Use it underneath multi-timeframe or forecast-style indicators for added context.
Disclaimer
This indicator produces visual and informational outputs only. It does not generate trade signals, entry/exit rules, or backtestable strategies. The tool is intended purely as an educational resource to help users interpret market behavior. It does not constitute financial advice, and past performance does not guarantee future results. Trading involves risk, and you may lose some or all of your investment.
Release Notes:
v1.0 (Initial Release)
招待専用スクリプト
このスクリプトは作者が承認したユーザーのみアクセス可能です。使用するにはアクセス申請をして許可を得る必要があります。通常は支払い後に承認されます。詳細は下記の作者の指示に従うか、Predator-Trading-Systemsに直接お問い合わせください。
TradingViewは、作者を完全に信頼し、スクリプトの動作を理解していない限り、有料スクリプトの購入・使用を推奨しません。コミュニティスクリプトには無料のオープンソースの代替が多数あります。
作者の指示
Get access here: https://predatortradingsystems.com/
免責事項
この情報および投稿は、TradingViewが提供または推奨する金融、投資、トレード、その他のアドバイスや推奨を意図するものではなく、それらを構成するものでもありません。詳細は利用規約をご覧ください。