OPEN-SOURCE SCRIPT
Extreme Volumes
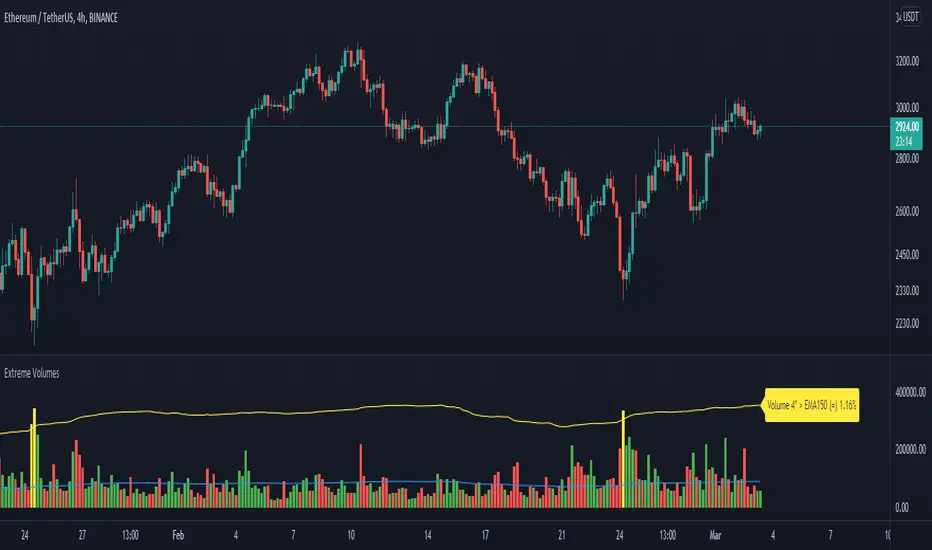
The aim of this volume indicator is quite simple: to pinpoint extreme volume spikes and how unusual these extremes are in comparison to all the chart's volumes.
The label displayed at the end of the indicator updates according to the settings you choose;
It shows the volume EMA length and how many times (the EMA) the current volume bar as to be above to be considered extreme.
Finally, the percentage at the end of the label tells how unusual the defined extreme volumes are compared to the whole chart's volumes (the smaller the percentage, the more unusual these "extreme" volumes are).
オープンソーススクリプト
TradingViewの精神に則り、このスクリプトの作者はコードをオープンソースとして公開してくれました。トレーダーが内容を確認・検証できるようにという配慮です。作者に拍手を送りましょう!無料で利用できますが、コードの再公開はハウスルールに従う必要があります。
免責事項
この情報および投稿は、TradingViewが提供または推奨する金融、投資、トレード、その他のアドバイスや推奨を意図するものではなく、それらを構成するものでもありません。詳細は利用規約をご覧ください。
オープンソーススクリプト
TradingViewの精神に則り、このスクリプトの作者はコードをオープンソースとして公開してくれました。トレーダーが内容を確認・検証できるようにという配慮です。作者に拍手を送りましょう!無料で利用できますが、コードの再公開はハウスルールに従う必要があります。
免責事項
この情報および投稿は、TradingViewが提供または推奨する金融、投資、トレード、その他のアドバイスや推奨を意図するものではなく、それらを構成するものでもありません。詳細は利用規約をご覧ください。