PROTECTED SOURCE SCRIPT
Market Roadmap [v1.0]
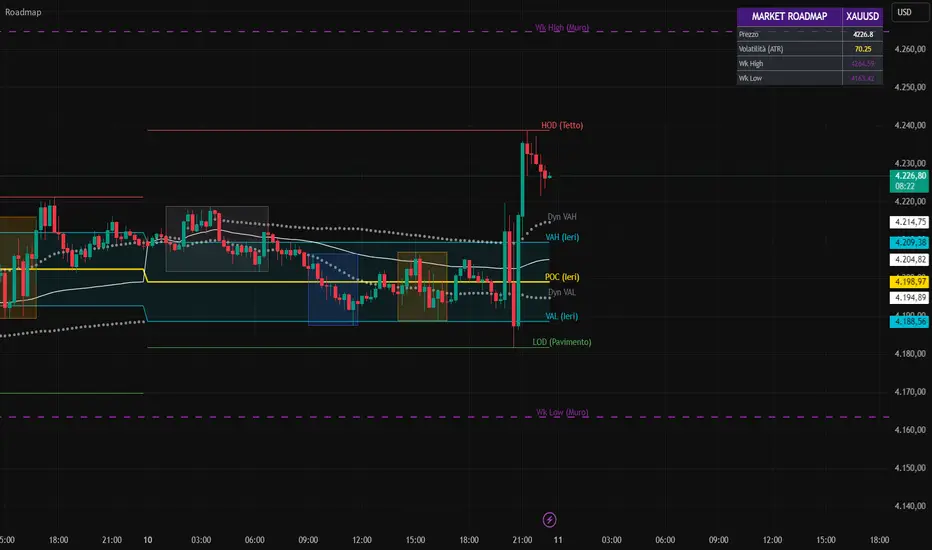
Market Roadmap: Il tuo GPS per il Trading Intraday
Questo indicatore è progettato per portare ordine nel caos dei grafici. Non serve a "predire il futuro", ma a fornirti una mappa chiara per non perderti durante la sessione di trading. Elimina il rumore di fondo e ti mostra solo i livelli istituzionali che contano davvero.
GUIDA RAPIDA ALL'USO
1. Dove siamo ORA? (Le Linee che si muovono) Queste linee definiscono il "recinto" della giornata in corso:
🔴 Linea Rossa (HOD): È il "Tetto" di oggi. Se il prezzo lo rompe, stiamo salendo (Trend Long).
🟢 Linea Verde (LOD): È il "Pavimento" di oggi. Se il prezzo lo rompe, stiamo scendendo (Trend Short).
⚪ Linea Bianca (VWAP): È la strada maestra. Se stiamo sopra, cerchiamo acquisti. Se stiamo sotto, cerchiamo vendite.
2. Dove sono i Pericoli? (Le Linee Fisse) Questi sono i livelli storici dove il prezzo spesso reagisce:
🟣 Linee Viola (Weekly): Sono muri di cemento armato. Indicano i massimi e minimi della settimana scorsa. Il prezzo lì rimbalza quasi sempre.
🟡 Linea Oro (POC): È dove ieri c'era più "traffico" (Volume). Il prezzo ama tornarci per fare una sosta (Magnete).
3. Che ore sono? (I Rettangoli) Visualizza a colpo d'occhio le fasi della giornata (Sessioni):
⬜ Grigio (Asia): Notte fonda. Il mercato dorme o accumula.
🟦 Blu (Londra): Mattina (09:00-12:00). Attenzione alle finte rotture (Manipolazione)!
🟧 Arancione (New York): Pomeriggio (14:00-17:00). Qui spesso parte il trend vero o l'inversione.
Per chi è questo script? Ideale per trader principianti e intermedi che vogliono smettere di indovinare e iniziare a seguire una struttura logica e professionale. Perfetto su XAUUSD (Gold), Indici e Forex.
_________________________________________________________________________________
Description:
Market Roadmap: Your GPS for Intraday Trading
This indicator is designed to bring order to chart chaos. It’s not about "predicting the future," but providing a clear map so you never get lost during a trading session. It filters out the noise and highlights only the institutional levels that truly matter.
QUICK START GUIDE
1. Where are we NOW? (Dynamic Lines) These lines define the current day's structure:
🔴 Red Line (HOD): Today's "Ceiling". If price breaks above, we are trending up.
🟢 Green Line (LOD): Today's "Floor". If price breaks below, we are trending down.
⚪ White Line (VWAP): The Main Road. Above it, look for buys. Below it, look for sells.
2. Where are the Obstacles? (Fixed Lines) Historical levels where price often reacts:
🟣 Purple Lines (Weekly): Concrete walls. These are last week's Highs and Lows. Price almost always bounces here.
🟡 Gold Line (POC): Yesterday's highest traffic zone (Volume). Price loves to return here as a magnet.
3. What time is it? (Session Boxes) Visualize the market phases instantly:
⬜ Grey (Asia): Overnight. Market is sleeping or accumulating.
🟦 Blue (London): Morning (09:00-12:00). Watch out for fake breakouts (Manipulation)!
🟧 Orange (New York): Afternoon (14:00-17:00). This is where the real trend or reversal often happens.
Who is this for? Perfect for beginner and intermediate traders who want to stop guessing and start following a logical, professional structure. Ideal for XAUUSD (Gold), Indices, and Forex.
保護スクリプト
このスクリプトのソースコードは非公開で投稿されています。 ただし、制限なく自由に使用できます – 詳細はこちらでご確認ください。
免責事項
この情報および投稿は、TradingViewが提供または推奨する金融、投資、トレード、その他のアドバイスや推奨を意図するものではなく、それらを構成するものでもありません。詳細は利用規約をご覧ください。
保護スクリプト
このスクリプトのソースコードは非公開で投稿されています。 ただし、制限なく自由に使用できます – 詳細はこちらでご確認ください。
免責事項
この情報および投稿は、TradingViewが提供または推奨する金融、投資、トレード、その他のアドバイスや推奨を意図するものではなく、それらを構成するものでもありません。詳細は利用規約をご覧ください。