INVITE-ONLY SCRIPT
更新済 SFC Macroeconomics
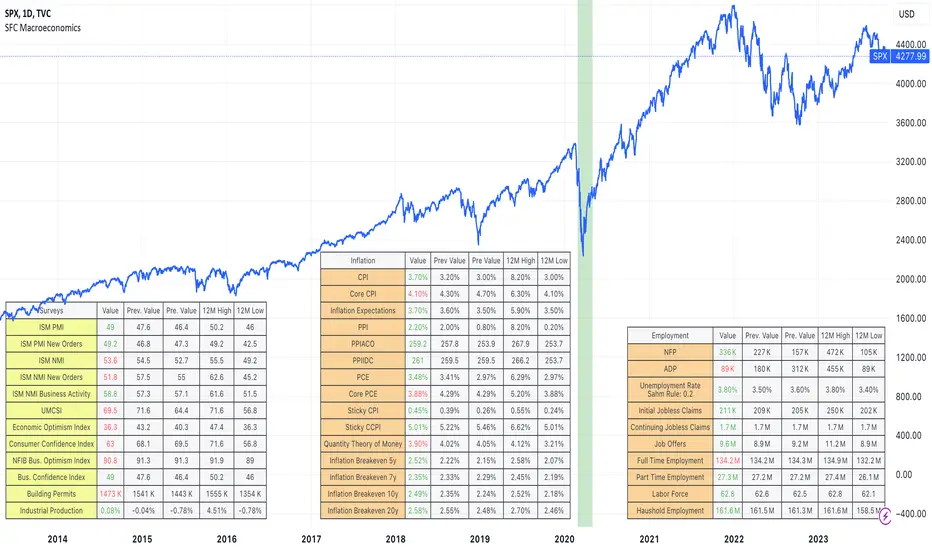
The Macroeconomics indicator can give us an instant view of the most important economic indicators. The indicator displays different tables in different sectors:
- Money : It give us a basic information about the money indicators in USA;
- Surveys: They are usually used as leading indicators.
- Inflation: It is showing overall inflation in the country
- Employment: Provides deep information about the current labor market
- Government: Usually legging indicators, but providing very good information about the USA
- Others: Few important indicators, for example GDP.
How we can use the indicator:
1) The indicator can be used to help traders, getting an instant overview of the economic indicators, helping them to create the Macroeconomic analysis.
2) The indicator can be use as a preparation before the high-impact news.
Note:
Yellow colour - leading indicators
Orange colour - legging indicators
Tables are showing the current data, also 12 months high and low. This is very important information, because it shows the extremes and normally if the current data is 12 months high or low it will be observed by the big players.
Before use this indicator, traders need basic macroeconomic understanding. A good knowledge is required in order to take advantage of the indicators and create the economic analysis or bias.
リリースノート
-added ADPリリースノート
- added historical recession- added Sahm Rule
- changed the overlay
リリースノート
- new symbols added to give us a more detailed picture- transferred some of the data to another indicator
- Show more previous values to understand how data changes.
- added tooltips
招待専用スクリプト
このスクリプトは作者が承認したユーザーのみアクセス可能です。使用するにはアクセス申請をして許可を得る必要があります。通常は支払い後に承認されます。詳細は下記の作者の指示に従うか、SerpentForexClubに直接お問い合わせください。
TradingViewは、作者を完全に信頼し、スクリプトの動作を理解していない限り、有料スクリプトの購入・使用を推奨しません。コミュニティスクリプトには無料のオープンソースの代替が多数あります。
作者の指示
Contact me through the PM system.
免責事項
この情報および投稿は、TradingViewが提供または推奨する金融、投資、トレード、その他のアドバイスや推奨を意図するものではなく、それらを構成するものでもありません。詳細は利用規約をご覧ください。