PROTECTED SOURCE SCRIPT
Horizontal Line Pattern (adj #of lines, color, timeframe, top)
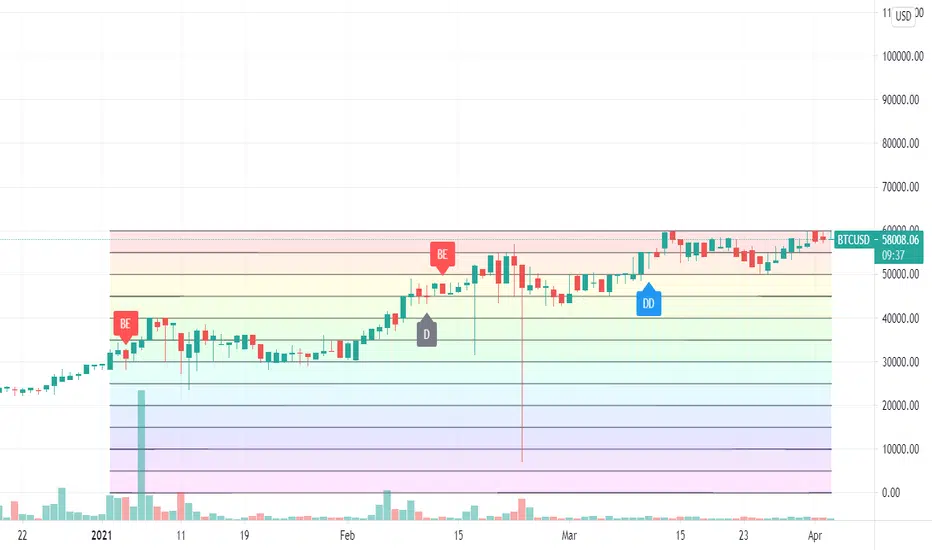
The simple script allows you to subdivide and price range into a number of equal segments. For example, you can divide 50,000 to 60,000 into 2,4, or 7 lines. You can also set the beginning date and the end date. This can be useful as prices tend to hover around whole numbers or ratios of whole numbers.
You must use settings to set the number of lines and the start and end dates. You can also change the line thickness and the color scheme.
You must use settings to set the number of lines and the start and end dates. You can also change the line thickness and the color scheme.
保護スクリプト
このスクリプトのソースコードは非公開で投稿されています。 ただし、制限なく自由に使用できます – 詳細はこちらでご確認ください。
免責事項
この情報および投稿は、TradingViewが提供または推奨する金融、投資、トレード、その他のアドバイスや推奨を意図するものではなく、それらを構成するものでもありません。詳細は利用規約をご覧ください。
保護スクリプト
このスクリプトのソースコードは非公開で投稿されています。 ただし、制限なく自由に使用できます – 詳細はこちらでご確認ください。
免責事項
この情報および投稿は、TradingViewが提供または推奨する金融、投資、トレード、その他のアドバイスや推奨を意図するものではなく、それらを構成するものでもありません。詳細は利用規約をご覧ください。