OPEN-SOURCE SCRIPT
CakeProfits-SMA+EMA G
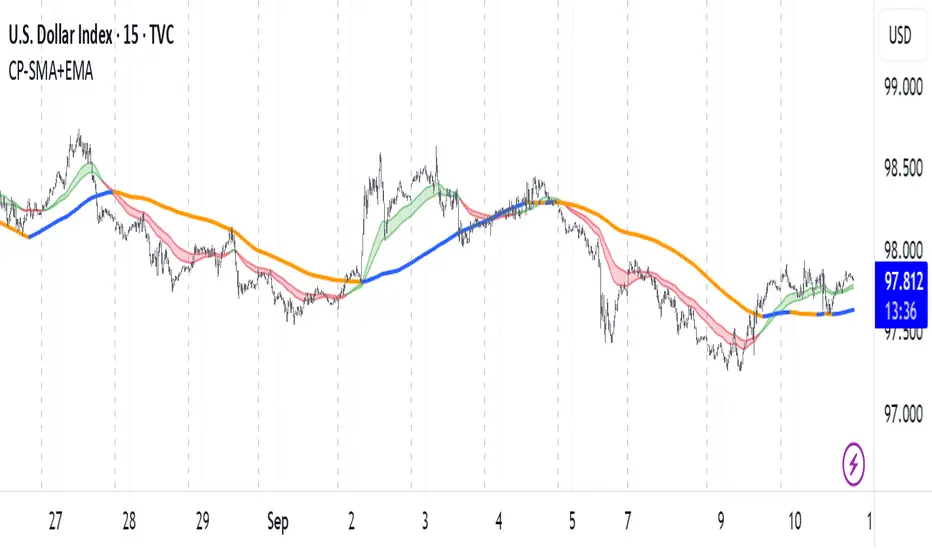
This indicator plots a dynamic color coded MA ribbon that visually highlights the relationship between a Simple Moving Average (SMA) and an Exponential Moving Average (EMA). The ribbon changes color based on bullish or bearish crossovers:
Bullish – EMA crosses above the SMA, indicating upward momentum.
Bearish – EMA crosses below the SMA, signaling potential downward pressure.
The SMA smooths out long-term price trends, while the EMA responds faster to recent price action. Together, they help traders identify shifts in market direction and momentum strength. The ribbon provides a clear, at-a-glance view of trend changes and can be used on any timeframe or market.
There is also the option to display a 200 SMA that is also color coded.
Common Uses:
Confirming trend direction.
Identifying early entry/exit points.
Filtering trades for trend-following strategies.
オープンソーススクリプト
TradingViewの精神に則り、この作者はスクリプトのソースコードを公開しているので、その内容を理解し検証することができます。作者に感謝です!無料でお使いいただけますが、このコードを投稿に再利用する際にはハウスルールに従うものとします。
免責事項
これらの情報および投稿は、TradingViewが提供または保証する金融、投資、取引、またはその他の種類のアドバイスや推奨を意図したものではなく、またそのようなものでもありません。詳しくは利用規約をご覧ください。
オープンソーススクリプト
TradingViewの精神に則り、この作者はスクリプトのソースコードを公開しているので、その内容を理解し検証することができます。作者に感謝です!無料でお使いいただけますが、このコードを投稿に再利用する際にはハウスルールに従うものとします。
免責事項
これらの情報および投稿は、TradingViewが提供または保証する金融、投資、取引、またはその他の種類のアドバイスや推奨を意図したものではなく、またそのようなものでもありません。詳しくは利用規約をご覧ください。