PROTECTED SOURCE SCRIPT
DistributionDays_FTD_iDavinderK
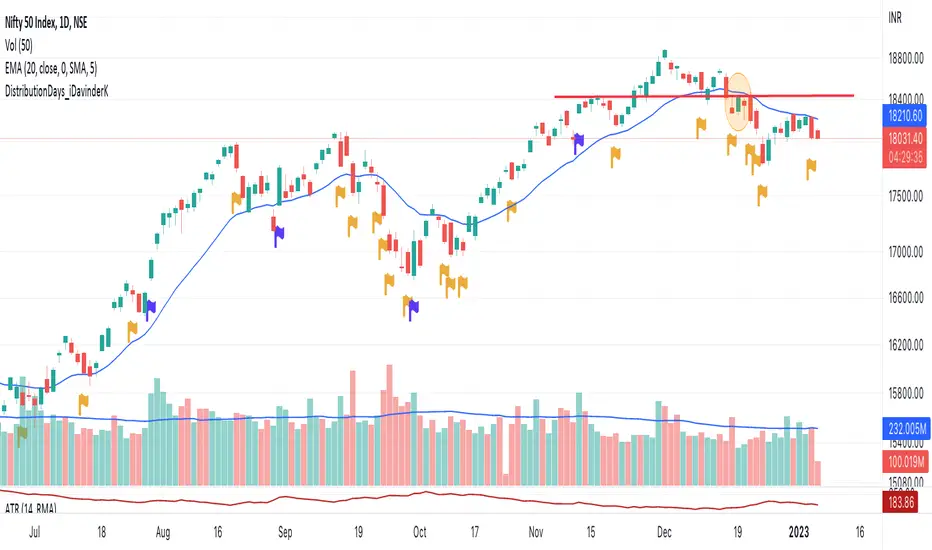
This script identifies the distribution days and follow through day.
DD count helps a trader identify a general trend of the market. A distribution day is flagged when index drops more than 0.2% and above average vols than previous day. 4 or more distribution days shows choppiness in the market and longs are unlikely to work.
A follow through day on the other hand shows strong buying emerges from the bottom. An FTD is flagged when index moves up 1.5% or more on higher vols than previous day.
Once an FTD is seen DD count goes back to zero.
DD are shown as Yellow flag here.
FTD are shown as Blue flag,
保護スクリプト
このスクリプトのソースコードは非公開で投稿されています。 ただし、制限なく自由に使用できます – 詳細はこちらでご確認ください。
免責事項
この情報および投稿は、TradingViewが提供または推奨する金融、投資、トレード、その他のアドバイスや推奨を意図するものではなく、それらを構成するものでもありません。詳細は利用規約をご覧ください。
免責事項
この情報および投稿は、TradingViewが提供または推奨する金融、投資、トレード、その他のアドバイスや推奨を意図するものではなく、それらを構成するものでもありません。詳細は利用規約をご覧ください。