PROTECTED SOURCE SCRIPT
ATR Dashboard
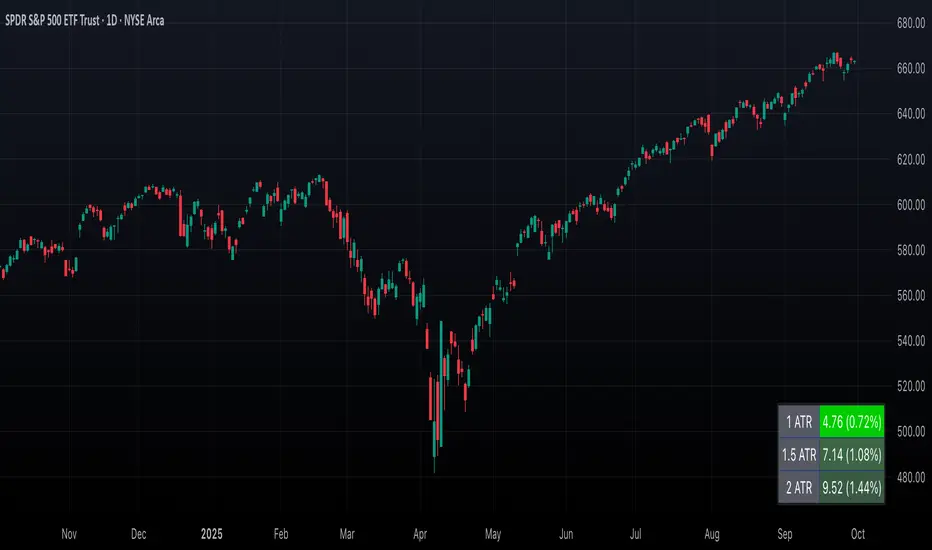
This lightweight overlay indicator displays Average True Range (ATR) values in a clean, customizable table format directly on your chart. Designed for swing traders and intraday traders alike, it transforms raw ATR data into actionable risk and position-sizing insights without adding visual clutter.
Key Features
- ATR Calculation: Fully configurable ATR period (default 14).
- Multiplier Display: Instantly see ATR-based ranges with multipliers (default 1.0x, 1.5x and 2.0x, but fully customizable).
- Risk Visualization: Color-coded percentage values show how far the price has moved relative to ATR levels—helping traders gauge volatility and overextension.
- Flexible Positioning: Choose from 9 placement options to position the dashboard wherever it best fits your chart layout.
- Real-Time Updates: Displays both absolute ATR values (in price units) and percentage equivalents, adapting instantly as price action evolves.
- Minimal & Non-Intrusive: Compact, distraction-free design ensures you get the data you need without obstructing candles or indicators.
How Traders Use It
- Swing and intraday traders use ATR not only to measure volatility but also to manage risk and identify trade levels. This dashboard makes that process intuitive:
- Volatility Gauge: Traders quickly assess whether the market is quiet (low ATR) or volatile (high ATR), guiding strategy selection.
- Dynamic Risk Levels: ATR multipliers provide context for setting stops and profit targets—e.g., placing a stop 1.5x ATR away helps filter out noise.
- Overextension Signals: If price moves too far relative to ATR (long wicks beyond ATR multiples), it can suggest exhaustion or reversal zones.
- Position Sizing: ATR-based values help traders size positions according to volatility, reducing the chance of oversized risk in choppy markets.
Perfect Use Cases
- Risk Management: Define stop-losses and profit targets relative to market volatility.
- Volatility Analysis: Adapt strategies to current market conditions.
- Swing & Intraday Trading: Identify when markets are extended and due for a retracement.
- Systematic Trading: Standardize trade execution with objective volatility metrics.
保護スクリプト
このスクリプトのソースコードは非公開で投稿されています。 However, you can use it freely and without any limitations – learn more here.
免責事項
この情報および投稿は、TradingViewが提供または推奨する金融、投資、トレード、その他のアドバイスや推奨を意図するものではなく、それらを構成するものでもありません。詳細は利用規約をご覧ください。
保護スクリプト
このスクリプトのソースコードは非公開で投稿されています。 However, you can use it freely and without any limitations – learn more here.
免責事項
この情報および投稿は、TradingViewが提供または推奨する金融、投資、トレード、その他のアドバイスや推奨を意図するものではなく、それらを構成するものでもありません。詳細は利用規約をご覧ください。