INVITE-ONLY SCRIPT
更新済 MTF Dots BTC-Pair [Auto] [Moto]
Hello traders,
Rsi is pretty commonly used and for some good reasons. When I'm trading, I don't always want to use the USDT/USDTPERP rsi, I want to see the correlated BTC pair Rsi of that asset
This script is similar to my MTF Dots and MTF Dots Cor scripts, but with an important and crucial distinction.
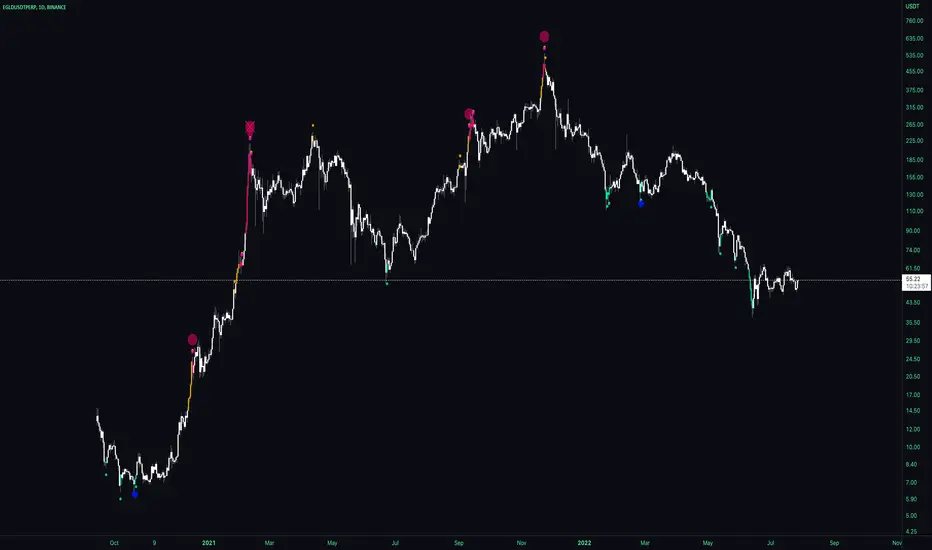
This shows user input oversold and overbought RSI metrics for multiple simultaneous timeframes comparatively to a perpetual futures contracts respective BTC pair automatically.
IMPORTANT: As of posting, the script will only show relevant information if the observed chart is a Binance perp chart. Any other chart and the script will not show data.
For example, if a user is on the BINANCE:SOLUSDTPERP chart, the script will show oversold and overbought Rsi data points for BINANCE:SOLBTC. If observing the BINANCE:ZRXUSDTPERP chart, it will give metrics for BINANCE:ZRXBTC Rsi.
There are six time frames, set to "Chart" resolution by default, which have individual period, overbought and oversold levels of strength.


DM for access,
Thanks
Rsi is pretty commonly used and for some good reasons. When I'm trading, I don't always want to use the USDT/USDTPERP rsi, I want to see the correlated BTC pair Rsi of that asset
This script is similar to my MTF Dots and MTF Dots Cor scripts, but with an important and crucial distinction.
This shows user input oversold and overbought RSI metrics for multiple simultaneous timeframes comparatively to a perpetual futures contracts respective BTC pair automatically.
IMPORTANT: As of posting, the script will only show relevant information if the observed chart is a Binance perp chart. Any other chart and the script will not show data.
For example, if a user is on the BINANCE:SOLUSDTPERP chart, the script will show oversold and overbought Rsi data points for BINANCE:SOLBTC. If observing the BINANCE:ZRXUSDTPERP chart, it will give metrics for BINANCE:ZRXBTC Rsi.
There are six time frames, set to "Chart" resolution by default, which have individual period, overbought and oversold levels of strength.
DM for access,
Thanks
リリースノート
Included confluence filter via candle direction. Organized inputs into resolutions. Slight edit to first OS/OB levelリリースノート
Added tickersリリースノート
Tweaked default values, added addition signal of conviction. Fixed typos. リリースノート
Added alerts for "Valley" and "Peak"招待専用スクリプト
このスクリプトは作者が承認したユーザーのみアクセス可能です。使用するにはアクセス申請をして許可を得る必要があります。通常は支払い後に承認されます。詳細は下記の作者の指示に従うか、Intromotoに直接お問い合わせください。
TradingViewは、作者を完全に信頼し、スクリプトの動作を理解していない限り、有料スクリプトの購入・使用を推奨しません。コミュニティスクリプトには無料のオープンソースの代替が多数あります。
作者の指示
DM for access
DM for access.
Follow on Twitter for updates.
One time fee, no subscription
twitter.com/IntroMoto
Follow on Twitter for updates.
One time fee, no subscription
twitter.com/IntroMoto
免責事項
この情報および投稿は、TradingViewが提供または推奨する金融、投資、トレード、その他のアドバイスや推奨を意図するものではなく、それらを構成するものでもありません。詳細は利用規約をご覧ください。
招待専用スクリプト
このスクリプトは作者が承認したユーザーのみアクセス可能です。使用するにはアクセス申請をして許可を得る必要があります。通常は支払い後に承認されます。詳細は下記の作者の指示に従うか、Intromotoに直接お問い合わせください。
TradingViewは、作者を完全に信頼し、スクリプトの動作を理解していない限り、有料スクリプトの購入・使用を推奨しません。コミュニティスクリプトには無料のオープンソースの代替が多数あります。
作者の指示
DM for access
DM for access.
Follow on Twitter for updates.
One time fee, no subscription
twitter.com/IntroMoto
Follow on Twitter for updates.
One time fee, no subscription
twitter.com/IntroMoto
免責事項
この情報および投稿は、TradingViewが提供または推奨する金融、投資、トレード、その他のアドバイスや推奨を意図するものではなく、それらを構成するものでもありません。詳細は利用規約をご覧ください。