PROTECTED SOURCE SCRIPT
更新済 Lite Trading Diary : equity curve
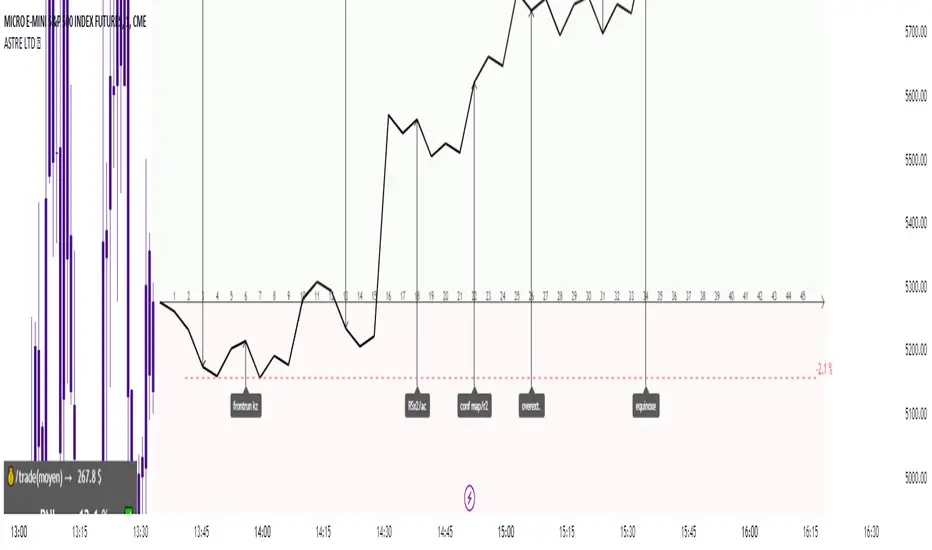
Dynamic trading journal with equity curve display. Detailed results with prop firm objectives, editable, $/month estimation, possibility to compare two strategies.
one line in parameter = one trade.
For each trade, specify : RR (Win, or "-1" for a stoploss), type of trade, and a comment.
The bottom left table summarizes the overall performance with some key information. RA return => Risk adjusted performance.
there is the possibility to define a "Type" : type 1, 2 or 3. It allows to split the equity curve. You can thus distinguish the different sub-strategies of your strategy, visually see their effectiveness, and be able to adjust your risk exposure accordingly.
Learn from your backtests. Identify your strengths, your weaknesses, and improve!
All the conditions to succeed in the challenge are adjustable in the parameters. Please note : drawdown on the equity curve is max drawdown. On the table => static drawdown.
Use "A random day trading" indicator to spice up your training.
I hope this will be useful for you to track your performance !
リリースノート
fix picture保護スクリプト
このスクリプトのソースコードは非公開で投稿されています。 ただし、制限なく自由に使用できます – 詳細はこちらでご確認ください。
Most aggressive TradingView/MT4/MT5 trading setup on the market. Pure juice concentrated from SMC/ICT, divergences and PA!
Snipe the institutional levels! 🐋🏹
Snipe the institutional levels! 🐋🏹
免責事項
この情報および投稿は、TradingViewが提供または推奨する金融、投資、トレード、その他のアドバイスや推奨を意図するものではなく、それらを構成するものでもありません。詳細は利用規約をご覧ください。
保護スクリプト
このスクリプトのソースコードは非公開で投稿されています。 ただし、制限なく自由に使用できます – 詳細はこちらでご確認ください。
Most aggressive TradingView/MT4/MT5 trading setup on the market. Pure juice concentrated from SMC/ICT, divergences and PA!
Snipe the institutional levels! 🐋🏹
Snipe the institutional levels! 🐋🏹
免責事項
この情報および投稿は、TradingViewが提供または推奨する金融、投資、トレード、その他のアドバイスや推奨を意図するものではなく、それらを構成するものでもありません。詳細は利用規約をご覧ください。