PROTECTED SOURCE SCRIPT
ROC Tracker -> PROFABIGHI_CAPITAL
🌟 Overview
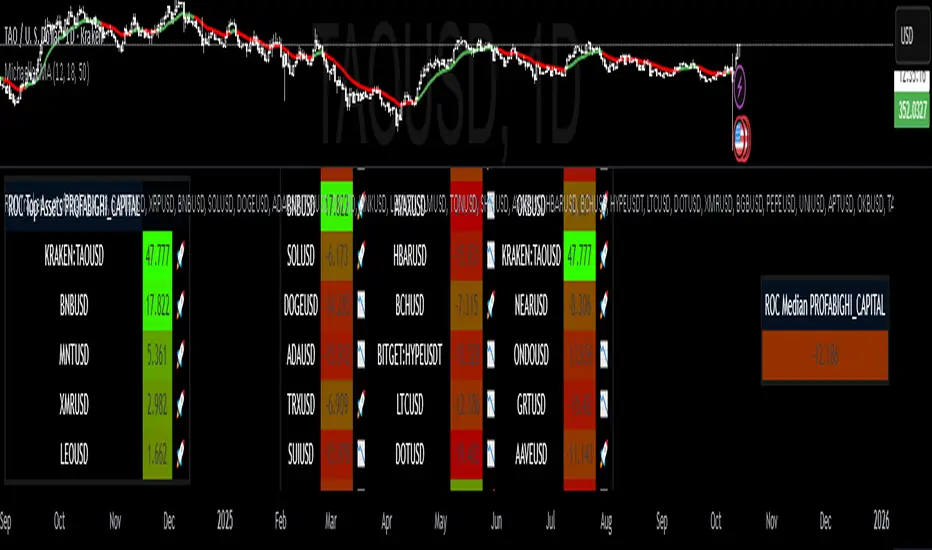
The ROC Tracker → PROFABIGHI_CAPITAL indicator measures momentum strength by calculating the Rate of Change (ROC) for up to 33 customizable altcoins over a user-specified period, revealing acceleration or deceleration in price movements. It dynamically generates color-gradient tables displaying individual ROC values, median benchmarks, and ranked top momentum performers with emoji indicators, allowing traders to spot surging assets for timely entries or fading ones for exits in volatile markets.
⚙️ General Settings
– ROC Period: Defines the lookback bars for percentage change computation, where shorter periods (e.g., 5-10) highlight immediate momentum bursts while longer spans (e.g., 20-50) capture sustained trends—key for aligning with trading horizons like scalping or swing setups.
💎 Asset Selection Settings
– Number of Altcoins to Display: Scales the primary table from a streamlined 5-asset view for rapid momentum checks to a full 33-symbol scan for broad-market acceleration profiling—balances detail with computational efficiency.
– Number of Top ROC Assets: Configures the momentum leaderboard to emphasize leading changers, adjustable from 1 for focused highlights to the total count for unbridled ranking—accelerates identification of breakout candidates.
– Asset 1-17 (Left Group): Curates the main table's left column with essential altcoins, enabling personalization from anchors like ETHUSD to varied inclusions such as XRPUSD—each retrieves daily closes for standalone ROC derivation, with tooltips confirming symbol standards.
– Asset 18-33 (Right Group): Populates the right column for diversified momentum tracking, incorporating further tokens from LTCUSD to specialized selections like MNTUSD—fosters balanced tri-column flow for lateral dataset review.
– Dynamic Input Rendering: Activates fields proportional to asset tally, veiling extras to sidestep errors and simplify navigation—facilitates effortless escalation from narrow lists to panoramic surveillance.
🎨 Table Style Settings
– Low ROC Color: Sets the gradient's deceleration base (e.g., deep red for negative changes), promptly signaling momentum fades that may prompt profit-taking or avoidance.
– High ROC Color: Anchors the acceleration peak (e.g., vivid green for positive changes), illuminating surging movers ripe for momentum continuation plays.
– Neutral ROC Value: Centers the color pivot at zero change (typically 0.0), modulating from loss to gain hues—adjustment biases toward conservative or aggressive momentum reads.
– ROC Color Range: Governs the transitional breadth around neutral, embracing wide fades for nuanced momentum gradients or narrow contrasts for binary surge/lag demarcation.
– Table Background: Deploys a muted dark semi-transparent canvas for thematic unity and cross-theme visibility, crafting an elegant momentum dashboard.
– Table Border: Enframes with neutral gray for subtle containment, encapsulating data without stylistic diversion.
📡 Data Fetching
– Asset Data Retrieval: Conducts concurrent daily close queries for nominated symbols, interposing NA for gaps to fortify table resilience.
– Return Series Computation: Applies 1-period percentage variances to asset paths, yielding the momentum quanta for period-based change metrics.
– Missing Data Resilience: Implants sentinels (-9999) for voids, rendering as grays to indicate incompleteness without structural breach.
🧮 Calculations
– Periodic Return Generation: Computes rate of change over the specified bars as current divided by prior minus unity, distilling momentum as percentage acceleration.
– Raw ROC Derivation: Directly yields the percentage shift over the lookback, quantifying speed without further averaging for pure velocity insight.
– NA Propagation Handling: Forwards missing values to preserve computational chain integrity, displaying as neutrals in outputs.
📋 Table Display
– Dynamic Layout Optimization: Erects columns (up to 9 for tri-set harmony) and rows attuned to asset volume plus header, assuring pithy utility for 1-33 symbols.
– Main Table Architecture: Branded header vaults the apical row, shadowed by asset symbols, rounded momenta (3 decimals), and velocity emojis in parsimonious trios for row-thrifty perusal.
– ROC Color Continuum: Cartographs values from low (red) via neutral (midpoint) to high (green), with grays for voids—precipitates immediate momentum profiling.
– Emoji Velocity Markers: Dispatches rocket for above-median changes (accelerators) and downward arrow for below (decelerators), infusing expeditious visual discernment.
– Median Table Encapsulation: Terse single-column depiction of pivotal momentum with gradient tint, mooring relative appraisals as a parity linchpin.
– Top ROC Table Hierarchy: Descending stratification in 3-column lattice (symbol, value, emoji) with header branding, converging on paramount assets for surge-dominant dispositions.
– Index-Fueled Ranking: Mobilizes array indices for descending distillation, refabricating sorted arrays while custodians originals for scrupulous median genesis.
🔔 Alerts
– Dynamic Alert Fabrication: Erects newline-segmented compendia of symbols and rounded momenta on the ultimate bar, amputating prefixes for laconic phrasing.
– Once-Per-Bar Dispatch: Ignites alerts at closure with the plenary dataset, harmonizing external adjuncts like dispatches or automata.
– Output Refinement: Distills parseable essence by eliding NAs, honing on operable datum for unencumbered conduit amalgamation.
✅ Key Takeaways
– ROC quantification unveils momentum velocity, spotlighting acceleration for timely pursuits.
– Rolling period with direct computation yields crisp, unaltered speed metrics.
– Profuse symbol pliancy forges bespoke crypto velocity observatories from titans to obscurities.
– Gradient lattices with medians and tops hasten surge/lag discernment through optics.
– Automated alerts encapsulate scans into consumable missives, hastening from scrutiny to stratagem.
保護スクリプト
このスクリプトのソースコードは非公開で投稿されています。 しかし、無料かつ制限なしでご利用いただけます ― 詳細についてはこちらをご覧ください。
免責事項
これらの情報および投稿は、TradingViewが提供または保証する金融、投資、取引、またはその他の種類のアドバイスや推奨を意図したものではなく、またそのようなものでもありません。詳しくは利用規約をご覧ください。
保護スクリプト
このスクリプトのソースコードは非公開で投稿されています。 しかし、無料かつ制限なしでご利用いただけます ― 詳細についてはこちらをご覧ください。
免責事項
これらの情報および投稿は、TradingViewが提供または保証する金融、投資、取引、またはその他の種類のアドバイスや推奨を意図したものではなく、またそのようなものでもありません。詳しくは利用規約をご覧ください。