PROTECTED SOURCE SCRIPT
LeiRos PRO — Smart Entry & Target System
⚡ Short Description
LeiRos PRO is more than an indicator.
It is an intelligent next-generation analytical tool designed to visualize the true trajectory of market movement.
It reveals the hidden mechanics of price — the attraction points where liquidity is collected and extremes are updated before reversal.
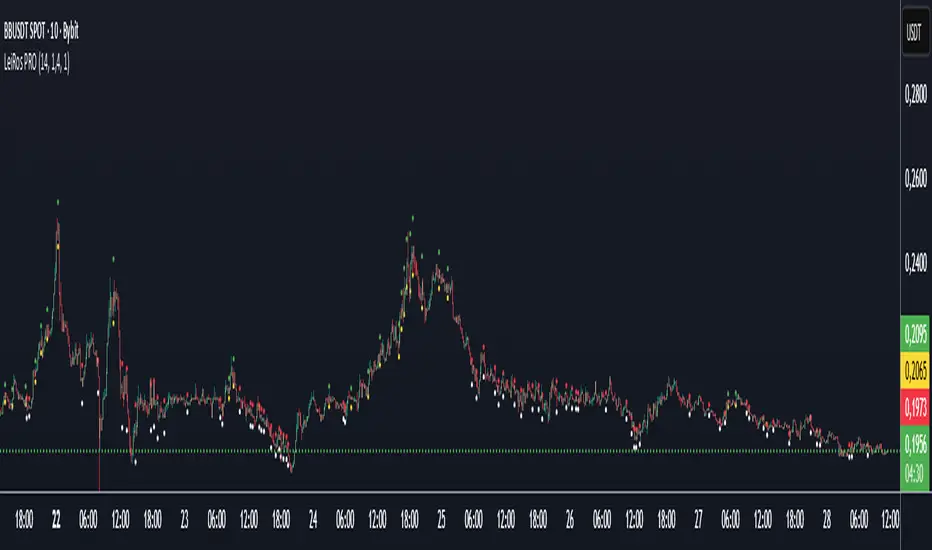
🟢 During bullish phases, the market often reaches for previous highs.
Green points of LeiRos PRO highlight the levels price is most likely to reach before completing the impulse.
⚪ In bearish phases, the market tends to sweep uncollected lows.
White points indicate where stop hunts and local reversals commonly occur.
Built upon the interaction of EMA20 / EMA50 / EMA200, volatility analysis and momentum strength,
LeiRos PRO doesn’t just mark levels — it displays realistic targets price is drawn to with high probability.
📈 The higher the timeframe, the clearer and more stable the picture becomes.
On H1 and above, the plotted points act as reference zones for those seeking structured, logical price behavior rather than noise.
💡 The main advantage of LeiRos PRO is clarity — it removes guessing.
You see where price tends to move and where impulses are likely to end.
This is not theory — it’s market behavior visualized.
📘 Full Description
LeiRos PRO is a proprietary analytical tool created to precisely visualize directional bias, target zones, and protective stop areas.
It combines trend structure, volatility, and price action logic — helping traders see the key areas where the market’s intent becomes clear.
📈 Core Features:
Automatic trend detection: analyzes direction using EMA20, EMA50, and EMA200 to define the dominant side of the market.
Target visualization (Take-Profit): marks potential liquidity-grab zones where price often completes its move.
Protective stop zones (Stop-Loss): highlights areas where logical stops can be placed based on current structure.
Adaptive to timeframe: higher timeframes provide cleaner and more reliable reference points, suitable for short-, medium-, and long-term analysis.
⚙️ Recommended Use:
As a visual analytical tool for confirming trade direction.
On lower TFs — for identifying intraday entry points and potential objectives.
On higher TFs (H1 and above) — for building overall market context and defining major targets.
Marked points are not entry signals,
but contextual reference zones showing potential areas of liquidity collection or impulse completion.
⚠️ Disclaimer:
LeiRos PRO is an analytical and visualization tool, not a trading signal or guarantee of results.
All trading decisions, entries, exits, and risk management remain solely the responsibility of the user.
✳️ Note:
This indicator is part of the LeiRos Project, which develops intelligent systems for advanced market analysis and visualization.
Displayed levels adapt dynamically to volatility and timeframe, providing a flexible view of current market structure.
LeiRos PRO is more than an indicator.
It is an intelligent next-generation analytical tool designed to visualize the true trajectory of market movement.
It reveals the hidden mechanics of price — the attraction points where liquidity is collected and extremes are updated before reversal.
🟢 During bullish phases, the market often reaches for previous highs.
Green points of LeiRos PRO highlight the levels price is most likely to reach before completing the impulse.
⚪ In bearish phases, the market tends to sweep uncollected lows.
White points indicate where stop hunts and local reversals commonly occur.
Built upon the interaction of EMA20 / EMA50 / EMA200, volatility analysis and momentum strength,
LeiRos PRO doesn’t just mark levels — it displays realistic targets price is drawn to with high probability.
📈 The higher the timeframe, the clearer and more stable the picture becomes.
On H1 and above, the plotted points act as reference zones for those seeking structured, logical price behavior rather than noise.
💡 The main advantage of LeiRos PRO is clarity — it removes guessing.
You see where price tends to move and where impulses are likely to end.
This is not theory — it’s market behavior visualized.
📘 Full Description
LeiRos PRO is a proprietary analytical tool created to precisely visualize directional bias, target zones, and protective stop areas.
It combines trend structure, volatility, and price action logic — helping traders see the key areas where the market’s intent becomes clear.
📈 Core Features:
Automatic trend detection: analyzes direction using EMA20, EMA50, and EMA200 to define the dominant side of the market.
Target visualization (Take-Profit): marks potential liquidity-grab zones where price often completes its move.
Protective stop zones (Stop-Loss): highlights areas where logical stops can be placed based on current structure.
Adaptive to timeframe: higher timeframes provide cleaner and more reliable reference points, suitable for short-, medium-, and long-term analysis.
⚙️ Recommended Use:
As a visual analytical tool for confirming trade direction.
On lower TFs — for identifying intraday entry points and potential objectives.
On higher TFs (H1 and above) — for building overall market context and defining major targets.
Marked points are not entry signals,
but contextual reference zones showing potential areas of liquidity collection or impulse completion.
⚠️ Disclaimer:
LeiRos PRO is an analytical and visualization tool, not a trading signal or guarantee of results.
All trading decisions, entries, exits, and risk management remain solely the responsibility of the user.
✳️ Note:
This indicator is part of the LeiRos Project, which develops intelligent systems for advanced market analysis and visualization.
Displayed levels adapt dynamically to volatility and timeframe, providing a flexible view of current market structure.
保護スクリプト
このスクリプトのソースコードは非公開で投稿されています。 ただし、制限なく自由に使用できます – 詳細はこちらでご確認ください。
免責事項
この情報および投稿は、TradingViewが提供または推奨する金融、投資、トレード、その他のアドバイスや推奨を意図するものではなく、それらを構成するものでもありません。詳細は利用規約をご覧ください。
保護スクリプト
このスクリプトのソースコードは非公開で投稿されています。 ただし、制限なく自由に使用できます – 詳細はこちらでご確認ください。
免責事項
この情報および投稿は、TradingViewが提供または推奨する金融、投資、トレード、その他のアドバイスや推奨を意図するものではなく、それらを構成するものでもありません。詳細は利用規約をご覧ください。