OPEN-SOURCE SCRIPT
更新済 Camarilla Pivot Points L3/4 D/W with Labels Alerts

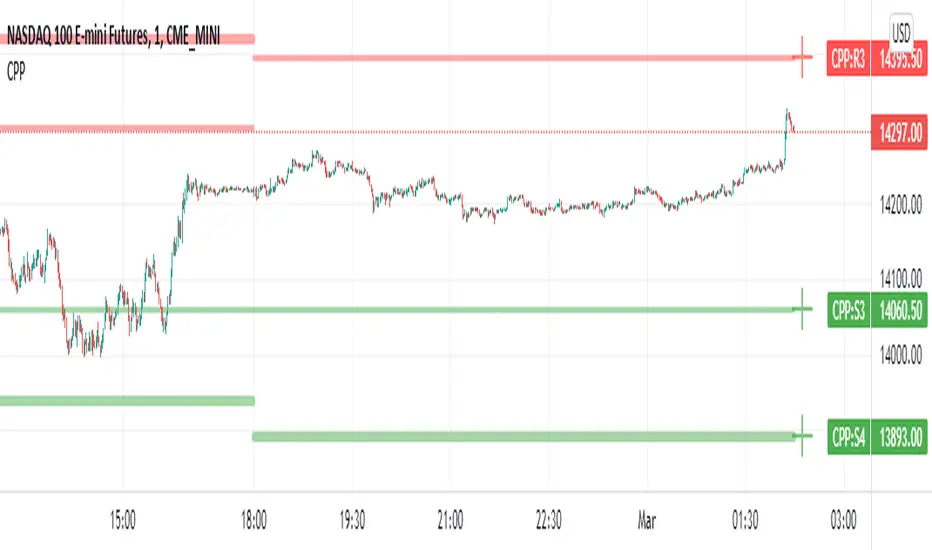
This version of the camarilla pivot points will provide daily or weekly S3, S4, R3 and R4 Levels.
This release is intended to help you declutter your charts by not having too many lines but still getting the benefit of clearly seeing where the key camarilla levels are, which can help with identifying market structure and potential market extremes.
It has the option to show or hide the lines to help unclutter your charts.
The lines can also be hidden by the user line transparency input, in which case the values will still appear on the scale.
It comes with a cross label for each pivot point that can be offset horizontally by user input. Per the screenshot, the intention is to have these labels adjacent to the right axis to clearly idenfity the pivot levels.
It also has alerts for each pivot point level
リリースノート
New version that allows color of support & resistance lines and markers (cross) be user selectable by input.Also made it clear that this covers monthly as well as daily or weekly pivots
リリースノート
Changed to text labels for clarityリリースノート
labels now have white textオープンソーススクリプト
TradingViewの精神に則り、このスクリプトの作者はコードをオープンソースとして公開してくれました。トレーダーが内容を確認・検証できるようにという配慮です。作者に拍手を送りましょう!無料で利用できますが、コードの再公開はハウスルールに従う必要があります。
免責事項
この情報および投稿は、TradingViewが提供または推奨する金融、投資、トレード、その他のアドバイスや推奨を意図するものではなく、それらを構成するものでもありません。詳細は利用規約をご覧ください。
オープンソーススクリプト
TradingViewの精神に則り、このスクリプトの作者はコードをオープンソースとして公開してくれました。トレーダーが内容を確認・検証できるようにという配慮です。作者に拍手を送りましょう!無料で利用できますが、コードの再公開はハウスルールに従う必要があります。
免責事項
この情報および投稿は、TradingViewが提供または推奨する金融、投資、トレード、その他のアドバイスや推奨を意図するものではなく、それらを構成するものでもありません。詳細は利用規約をご覧ください。