PROTECTED SOURCE SCRIPT
更新済 Volume Buzz - Real-Time Relative Volume Monitor
Don't trade in the dark—know if the market is paying attention.
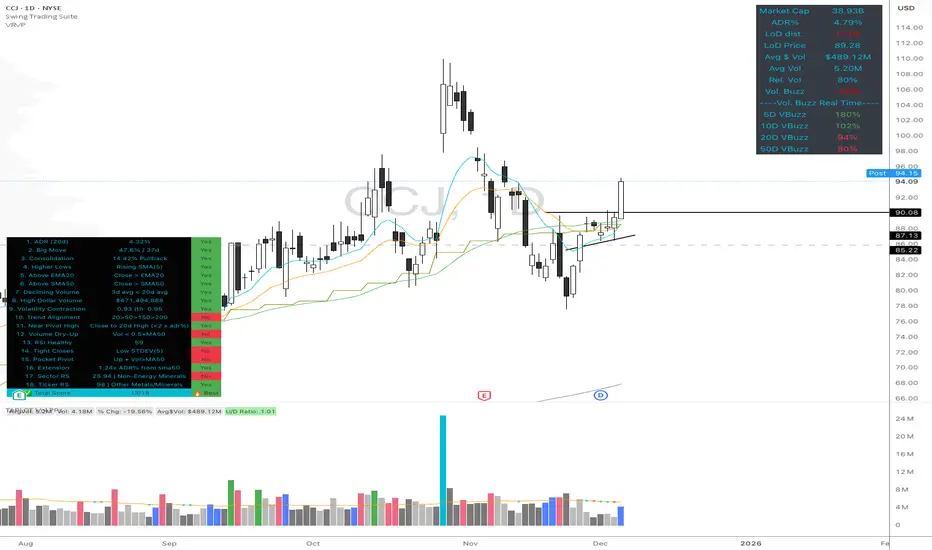
This indicator displays a simple dashboard on your chart that tells you if the current volume is Higher or Lower than the 20-day average for this specific time of day.
Green Text: High Relative Volume (RVol > 1). Good for spotting breakouts and momentum.
Red Text: Low Relative Volume (RVol < 1). Indicates consolidation or lack of interest.
Includes an optional "Realtime Adjustment" to predict the volume closing value before the bar actually closes.
リリースノート
compare to multiple daysリリースノート
added real time volume buzz (relative volume by time)保護スクリプト
このスクリプトのソースコードは非公開で投稿されています。 ただし、制限なく自由に使用できます – 詳細はこちらでご確認ください。
免責事項
この情報および投稿は、TradingViewが提供または推奨する金融、投資、トレード、その他のアドバイスや推奨を意図するものではなく、それらを構成するものでもありません。詳細は利用規約をご覧ください。
保護スクリプト
このスクリプトのソースコードは非公開で投稿されています。 ただし、制限なく自由に使用できます – 詳細はこちらでご確認ください。
免責事項
この情報および投稿は、TradingViewが提供または推奨する金融、投資、トレード、その他のアドバイスや推奨を意図するものではなく、それらを構成するものでもありません。詳細は利用規約をご覧ください。