PROTECTED SOURCE SCRIPT
CPR D/W/M – ThorenFX | Trinity Traders
🧭 CPR D/W/M – ThorenFX | Trinity Traders
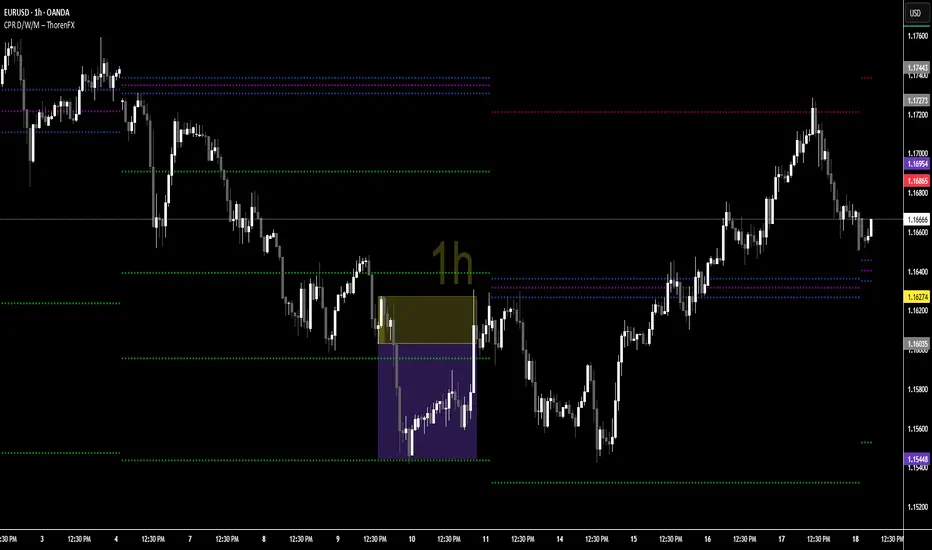
The CPR D/W/M – ThorenFX | Trinity Traders indicator plots Central Pivot Range (CPR) and Floor Pivot levels for Daily, Weekly, and Monthly timeframes — all in one script.
It helps traders identify market structure, bias, and potential reversal zones through multi-timeframe confluence of pivot levels.
⚙️ Core Logic
The indicator calculates each timeframe’s CPR and Support/Resistance levels using standard floor pivot formulas based on the previous period’s OHLC (Open, High, Low, Close):
Central Pivot Range (CPR):
Pivot (P) = (High + Low + Close) / 3
Top Central (TC) and Bottom Central (BC) define the CPR band
The distance between TC and BC indicates market volatility
Support & Resistance Levels:
R1–R4: Resistance zones above CPR
S1–S4: Support zones below CPR
All levels are dynamically plotted and color-coded for instant readability.
🧩 Included Timeframes
📅 Daily CPR → Ideal for intraday and short-term bias
🗓 Weekly CPR → Defines swing zones and trend continuation structure
📆 Monthly CPR → Long-term bias and institutional-level reaction zones
Each timeframe’s levels and labels can be toggled independently.
🎨 Visual Design
Element Color Description
Pivot (CPR) 🟣 Purple Central pivot point
TC / BC 🔵 Blue Top & Bottom CPR boundaries
Resistances (R1–R4) 🔴 Red Key resistance zones
Supports (S1–S4) 🟢 Green Key support zones
Labels are displayed on the right side of the chart for each level (e.g., D-R1, W-TC, M-CPR), allowing quick recognition without clutter.
📘 Usage Guide
Narrow CPR → Market likely to trend
Wide CPR → Market likely to range
Confluence of levels (e.g., Daily R1 ≈ Weekly CPR) often indicates high-probability reversal or breakout zones
Works across all markets — Forex, Indices, Commodities, and Equities
⚖️ Indicator Notes
Uses pure price-derived calculations (no lagging indicators).
Optimized for clarity, minimal overlap, and multi-timeframe confluence.
Each timeframe’s display and labels can be customized or hidden in settings.
Suitable for all timeframes and market types.
保護スクリプト
このスクリプトのソースコードは非公開で投稿されています。 しかし、無料かつ制限なしでご利用いただけます ― 詳細についてはこちらをご覧ください。
免責事項
これらの情報および投稿は、TradingViewが提供または保証する金融、投資、取引、またはその他の種類のアドバイスや推奨を意図したものではなく、またそのようなものでもありません。詳しくは利用規約をご覧ください。
保護スクリプト
このスクリプトのソースコードは非公開で投稿されています。 しかし、無料かつ制限なしでご利用いただけます ― 詳細についてはこちらをご覧ください。
免責事項
これらの情報および投稿は、TradingViewが提供または保証する金融、投資、取引、またはその他の種類のアドバイスや推奨を意図したものではなく、またそのようなものでもありません。詳しくは利用規約をご覧ください。