OPEN-SOURCE SCRIPT
更新済 Sweetspot Gold RN - by JustUncleL

This is an alternate version of "Sweetspot Gold R4" that does not use sublevels. Removing the sublevels allows more efficient use of the plots (TV script has a limit of 64 plot calls).
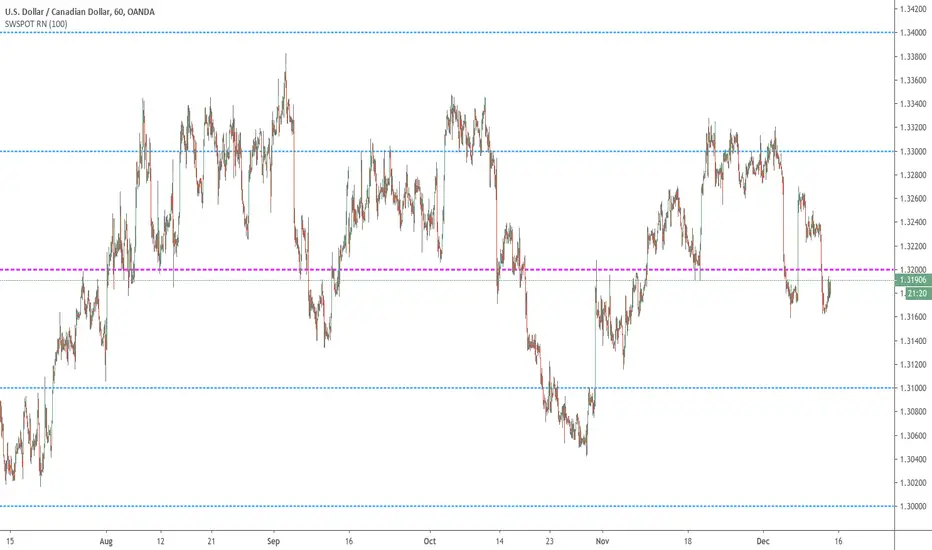
Use this indicator as a guidance to a better mapping of Support/Resistance levels on the chart. Next time you draw Support/Resistance lines, if they coincide with round price levels, you have got a excellent S/R level to work with!
- This works well for all currency pairs I've tested, most commodities, and most stocks.
- The indicator plots the so called "round price levels" or "00" levels. For example, 1.4000, 1.4400, 1.4500.
- It automatically calculates the levels for each chart time frame. Optionally you can manually select main level size (in pips)
Use this indicator as a guidance to a better mapping of Support/Resistance levels on the chart. Next time you draw Support/Resistance lines, if they coincide with round price levels, you have got a excellent S/R level to work with!
リリースノート
Update to improve the Automated RN for indices and commodities.- Modified the way the estimate for centreline is calculated.
- Modified levels calculation to improve finding correct RN for Indices and commodities.
- Added code to move centreline up to prevent negative RN values lines.
リリースノート
Small enhancement:- Modified estimate for centre line so that it is always occurs on a "000" line. This means the "000" labels (ZH3000,ZH2000,etc) will always have "000" values. This is handy when you want to manually highlight the bigger RNs.
リリースノート
- Simplify centre line calculation, just use last completed candle average price. This speeds up the script a bit.
- Convert to V4 Pinescript.
- Change line coloring.
- Added max_bars_back=200 to "study" parameters to try and prevent the occasional "index out of depth" error. Also change maxval=200 for centreline length.
オープンソーススクリプト
TradingViewの精神に則り、このスクリプトの作者はコードをオープンソースとして公開してくれました。トレーダーが内容を確認・検証できるようにという配慮です。作者に拍手を送りましょう!無料で利用できますが、コードの再公開はハウスルールに従う必要があります。
JustUncleL
免責事項
この情報および投稿は、TradingViewが提供または推奨する金融、投資、トレード、その他のアドバイスや推奨を意図するものではなく、それらを構成するものでもありません。詳細は利用規約をご覧ください。
オープンソーススクリプト
TradingViewの精神に則り、このスクリプトの作者はコードをオープンソースとして公開してくれました。トレーダーが内容を確認・検証できるようにという配慮です。作者に拍手を送りましょう!無料で利用できますが、コードの再公開はハウスルールに従う必要があります。
JustUncleL
免責事項
この情報および投稿は、TradingViewが提供または推奨する金融、投資、トレード、その他のアドバイスや推奨を意図するものではなく、それらを構成するものでもありません。詳細は利用規約をご覧ください。