INVITE-ONLY SCRIPT
SagaView
SagaView is an author's analytical tool where the visual part consists of zones and levels (these parts are described in more detail below).
This indicator allows you to determine whether the market is oversold or overbought, and use the levels of the indicator to determine the probability of price reversal.
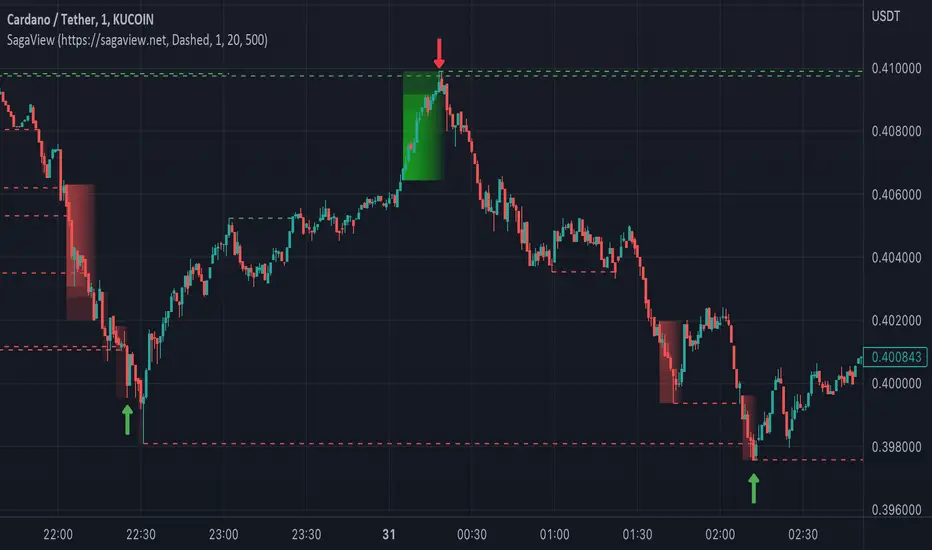
SagaView Zones
SagaView zones show areas of the market that are overbought/oversold. These zones are determined on the basis of the closing prices of the previous bars. SagaView zones may differ in size (number of candles included in the shaded area). The larger the size of the zone, the higher the probability of an imminent price reversal. Also, in the case of a smaller zone size, it can indicate the emergence of a strong movement. SagaView levels are used to determine the potential of movement and probability of reversal.
SagaView levels
SagaView levels are built from local extremums. These levels are potential levels of resistance or support. A large number of crossings of the level by the price usually reduces its importance. SagaView levels display a line on the chart only until it is crossed by price to filter a weak levels. Also, a level can lose its strength over time. But in SagaView you can filter out levels that are too old (even if they have not been crossed by price).
Using SagaView
Thus, the SagaView zones make it possible to determine the trending areas of the market (a number of bars in the shaded area), and the SagaView levels make it possible to assess the probability of a price reversal in these areas.
Disclamer: remember that financial markets carry risks and no trading tool will guarantee you earnings.
Only your cold mind and knowledge.
This indicator allows you to determine whether the market is oversold or overbought, and use the levels of the indicator to determine the probability of price reversal.
SagaView Zones
SagaView zones show areas of the market that are overbought/oversold. These zones are determined on the basis of the closing prices of the previous bars. SagaView zones may differ in size (number of candles included in the shaded area). The larger the size of the zone, the higher the probability of an imminent price reversal. Also, in the case of a smaller zone size, it can indicate the emergence of a strong movement. SagaView levels are used to determine the potential of movement and probability of reversal.
SagaView levels
SagaView levels are built from local extremums. These levels are potential levels of resistance or support. A large number of crossings of the level by the price usually reduces its importance. SagaView levels display a line on the chart only until it is crossed by price to filter a weak levels. Also, a level can lose its strength over time. But in SagaView you can filter out levels that are too old (even if they have not been crossed by price).
Using SagaView
Thus, the SagaView zones make it possible to determine the trending areas of the market (a number of bars in the shaded area), and the SagaView levels make it possible to assess the probability of a price reversal in these areas.
Disclamer: remember that financial markets carry risks and no trading tool will guarantee you earnings.
Only your cold mind and knowledge.
招待専用スクリプト
このスクリプトは作者が承認したユーザーのみアクセス可能です。使用するにはアクセス申請をして許可を得る必要があります。通常は支払い後に承認されます。詳細は下記の作者の指示に従うか、NorveCompに直接お問い合わせください。
TradingViewは、作者を完全に信頼し、スクリプトの動作を理解していない限り、有料スクリプトの購入・使用を推奨しません。コミュニティスクリプトには無料のオープンソースの代替が多数あります。
作者の指示
Get access here: https://sagaview.net
免責事項
この情報および投稿は、TradingViewが提供または推奨する金融、投資、トレード、その他のアドバイスや推奨を意図するものではなく、それらを構成するものでもありません。詳細は利用規約をご覧ください。