PROTECTED SOURCE SCRIPT
Liquidity Sweep Reversal
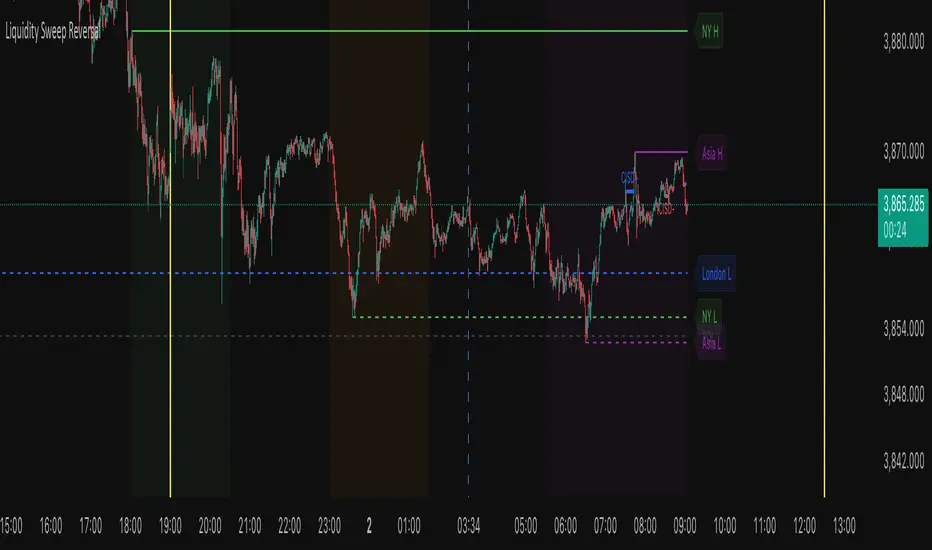
The Liquidity Sweep Reversal indicator is a sophisticated price-action-based tool designed for TradingView that identifies high-probability reversal setups by combining institutional liquidity concepts with session-based market structure. It detects potential reversals after price "sweeps" key support/resistance levels—such as prior day/week highs and lows or session extremes (Asian, London, New York)—followed by a rejection pattern.
The core logic revolves around two main signal types:
CISD (Close Inside, Sweep, Divergence) patterns that confirm liquidity grabs on higher timeframes.
Engulfing candlestick reversals occurring shortly after a touch of a key level within a defined lookback window.
To enhance relevance and reduce noise, the indicator optionally restricts signals to high-volatility “Killzone” sessions—including Asian, London, and New York AM/PM overlap periods—where institutional activity is typically concentrated.
Users can fully customize:
Timezone and higher timeframe (HTF) settings
Which key levels to monitor (PDH, PDL, PWH, PWL, session highs/lows)
Visual styling (line types, colors, labels)
Signal sensitivity (max bars after touch, signal size)
Display options (background highlights, level visibility, historical signal filtering)
Additionally, the script draws vertical lines for today’s and tomorrow’s London (08:00 CET) and New York (09:30 EST) market opens to provide contextual reference.
This tool is ideal for traders using auction market theory, order flow, or institutional footprint strategies who seek confluence between liquidity pools, session structure, and price rejection.
保護スクリプト
このスクリプトのソースコードは非公開で投稿されています。 ただし、制限なく自由に使用できます – 詳細はこちらでご確認ください。
免責事項
この情報および投稿は、TradingViewが提供または推奨する金融、投資、トレード、その他のアドバイスや推奨を意図するものではなく、それらを構成するものでもありません。詳細は利用規約をご覧ください。
保護スクリプト
このスクリプトのソースコードは非公開で投稿されています。 ただし、制限なく自由に使用できます – 詳細はこちらでご確認ください。
免責事項
この情報および投稿は、TradingViewが提供または推奨する金融、投資、トレード、その他のアドバイスや推奨を意図するものではなく、それらを構成するものでもありません。詳細は利用規約をご覧ください。