OPEN-SOURCE SCRIPT
更新済 Earnings X-Ray
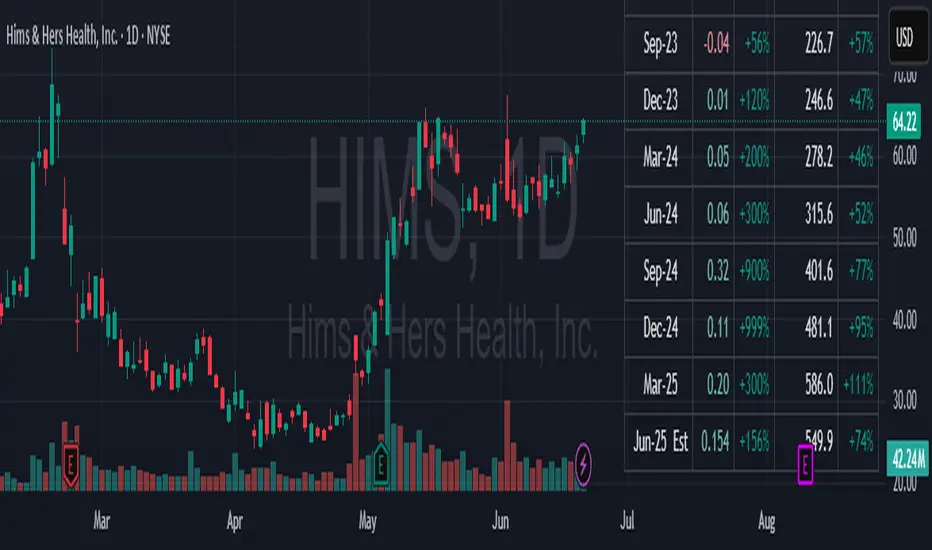
The script presents earnings and revenues in a tabular format. Particularly, it calculates percentage changes.
Earnings data can be found in TradingView Financials. However, percentage changes are not provided. Can TradingView implement this in the future?
Displaying earnings table on the chart has its benefits. No additional clicks required to access the data. This significantly streamlines the stock scanning process.
It is important to quickly evaluate a company's earnings when scanning for stocks. The script provides this capability.
Similar scripts have been created previously. This script corrects calculations and improves presentation with the concise code.
Data access:
Earnings = request.earnings(syminfo.tickerid, earnings.actual)
FutureEarnings = earnings.future_eps
FutureRevenue = earnings.future_revenue
Can more than one quarter of future earnings estimates become available in Pine Script in the future?
The script was validated against MarketSurge.
Features:
- Quarterly or Yearly data
- Configurable number of fiscal periods
- Configurable location on the chart
- Optional Dark mode
リリースノート
Bug fixes. Dark mode is now automatic. Optional color the for EPS column.リリースノート
Converted to Pine Script v6.Added Transparency setting.
Handled edge case for missing revenue value just after earnings release.
リリースノート
Minor bug fix.リリースノート
Update the chartオープンソーススクリプト
TradingViewの精神に則り、このスクリプトの作者はコードをオープンソースとして公開してくれました。トレーダーが内容を確認・検証できるようにという配慮です。作者に拍手を送りましょう!無料で利用できますが、コードの再公開はハウスルールに従う必要があります。
免責事項
この情報および投稿は、TradingViewが提供または推奨する金融、投資、トレード、その他のアドバイスや推奨を意図するものではなく、それらを構成するものでもありません。詳細は利用規約をご覧ください。
オープンソーススクリプト
TradingViewの精神に則り、このスクリプトの作者はコードをオープンソースとして公開してくれました。トレーダーが内容を確認・検証できるようにという配慮です。作者に拍手を送りましょう!無料で利用できますが、コードの再公開はハウスルールに従う必要があります。
免責事項
この情報および投稿は、TradingViewが提供または推奨する金融、投資、トレード、その他のアドバイスや推奨を意図するものではなく、それらを構成するものでもありません。詳細は利用規約をご覧ください。