INVITE-ONLY SCRIPT
更新済 QuantPivote
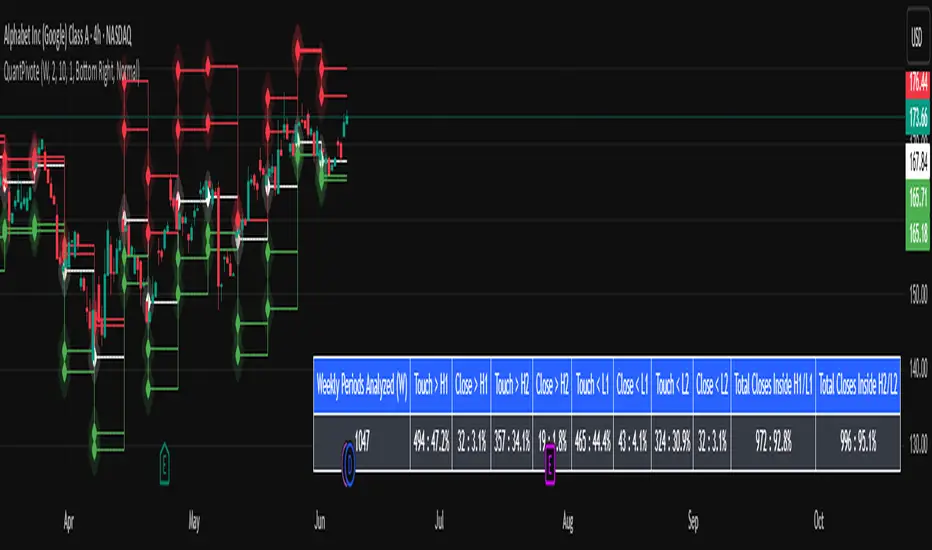
We are introducing the ST_QuantPivots Indicator, an advanced analytical tool meticulously crafted for ThinkOrSwim, which is now poised to debut on TradingView with Pine Script conversion.
Weekly Periods Analyzed :
Touch > H1 :
Close > H1 :
Touch > H2 :
Close > H2 :
Touch > L1 :
Close > L1 :
Touch > L2 :
Close > L2 :
Total Closes Inside H1 / L1 :
Total Closes Inside H2 / L2 :
Pivots :
Pivot lines are a function of the analysis and averaging period inputs.

Weekly Periods Analyzed :
- The number of total periods loaded and analyzed is on the chart.
Touch > H1 :
- Pivot level average price exceeded or was equal to, but did not close above.
Close > H1 :
- How often has the price closed above the H1 pivot level.
Touch > H2 :
- Pivot level one standard deviation above H1.
- The price exceeded or was equal to, but did not close above.
Close > H2 :
- How many times has the price closed above the H2 pivot level .
Touch > L1 :
- Pivot level average price exceeded or was equal to, but did not close below.
Close > L1 :
- How many times has the price closed below the L1 pivot level.
Touch > L2 :
- Pivot level one standard deviation below L1.
- The price exceeded or was equal to, but did not closed below.
Close > L2 :
- How many times has the price closed below the L2 pivot level.
Total Closes Inside H1 / L1 :
- Total number of times with in the periods analyzed that there were closes within H1 / L1 .
Total Closes Inside H2 / L2 :
- Total number of times with in the periods analyzed that there were closes within H2 / L2 respectively.
Pivots :
Pivot lines are a function of the analysis and averaging period inputs.
- H1 represents the average point which the highest price is achieved for the selected time period (analysis period).
- L1 represents the average point which the lowest price is achieved for the selected time period (analysis period).
- H2/L2 = One standard deviation away from the inner high H1 or low L1 bands.
リリースノート
Updated to from pinescript v5 to pinescript v6招待専用スクリプト
このスクリプトは作者が承認したユーザーのみアクセス可能です。使用するにはアクセス申請をして許可を得る必要があります。通常は支払い後に承認されます。詳細は下記の作者の指示に従うか、pineaflAlgoに直接お問い合わせください。
TradingViewは、作者を完全に信頼し、スクリプトの動作を理解していない限り、有料スクリプトの購入・使用を推奨しません。コミュニティスクリプトには無料のオープンソースの代替が多数あります。
作者の指示
This is a paid indicator. Please contact the author for a week's trial access on Trading View chat or Message on telegram with the Tradingview username https://t.me/pineafl for new feature requests reach out to pramod@pineafl.com
PineaflAlgo
免責事項
この情報および投稿は、TradingViewが提供または推奨する金融、投資、トレード、その他のアドバイスや推奨を意図するものではなく、それらを構成するものでもありません。詳細は利用規約をご覧ください。
招待専用スクリプト
このスクリプトは作者が承認したユーザーのみアクセス可能です。使用するにはアクセス申請をして許可を得る必要があります。通常は支払い後に承認されます。詳細は下記の作者の指示に従うか、pineaflAlgoに直接お問い合わせください。
TradingViewは、作者を完全に信頼し、スクリプトの動作を理解していない限り、有料スクリプトの購入・使用を推奨しません。コミュニティスクリプトには無料のオープンソースの代替が多数あります。
作者の指示
This is a paid indicator. Please contact the author for a week's trial access on Trading View chat or Message on telegram with the Tradingview username https://t.me/pineafl for new feature requests reach out to pramod@pineafl.com
PineaflAlgo
免責事項
この情報および投稿は、TradingViewが提供または推奨する金融、投資、トレード、その他のアドバイスや推奨を意図するものではなく、それらを構成するものでもありません。詳細は利用規約をご覧ください。