PROTECTED SOURCE SCRIPT
更新済 Master Pivots (CPR)
This helps in monitoring the support and resistance of the current day and plan for tomorrow's support and resistance. The formula for creating the indicator is as below.
Pivot Point (P) = (High + Low + Close)/3
Support 1 (S1) = (P x 2) - High
Support 2 (S2) = P - (High - Low)
Resistance 1 (R1) = (P x 2) - Low
Resistance 2 (R2) = P + (High - Low)
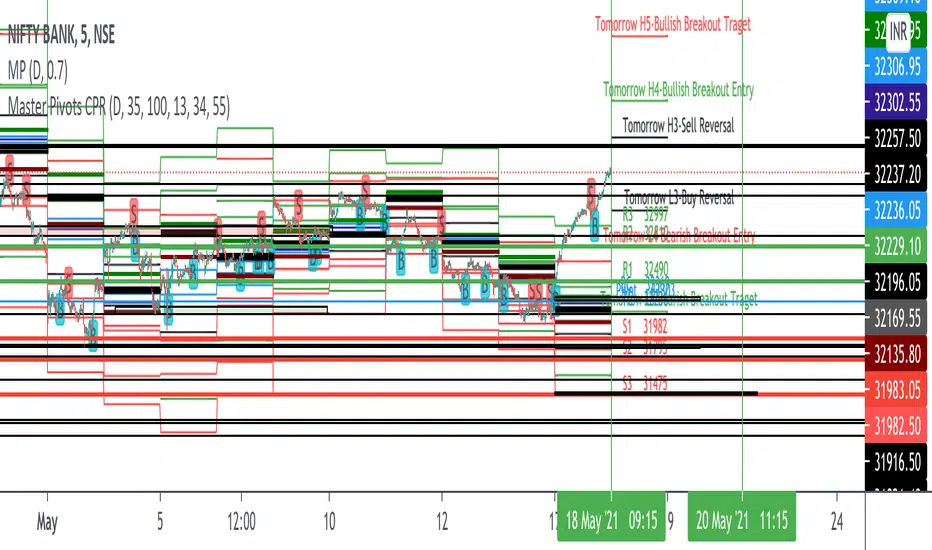
Floor Pivots are one of the classic pivot ranges and helps us in trading based on pivot values. This indicator that I have built is also capable of predicting tomorrow's support and resistance up to 3 levels i.e. R1, R2, R3 and S1, S2 and S3. This is the only indicator available in trading view which does the same. Thats the only reason of making a separate indicator.
In this indicator we have also added some symbols to identify the reversal patterns based on candle. This is best if used in 15 min candle. This plots engulfing pattern, shooting star, hammer and bullish and bearish reversals.
Please use it and provide feedback for changes. If i would change anything it would be available automatically anyway.
I have not added Fibonacci Pivots as its generally available in many sites out of box. How ever if you want to code you can use the below formula.
Pivot Point (P) = (High + Low + Close)/3
Support 1 (S1) = P - {.382 * (High - Low)}
Support 2 (S2) = P - {.618 * (High - Low)}
Support 3 (S3) = P - {1 * (High - Low)}
Resistance 1 (R1) = P + {.382 * (High - Low)}
Resistance 2 (R2) = P + {.618 * (High - Low)}
Resistance 3 (R3) = P + {1 * (High - Low)}
Pivot Point (P) = (High + Low + Close)/3
Support 1 (S1) = (P x 2) - High
Support 2 (S2) = P - (High - Low)
Resistance 1 (R1) = (P x 2) - Low
Resistance 2 (R2) = P + (High - Low)
Floor Pivots are one of the classic pivot ranges and helps us in trading based on pivot values. This indicator that I have built is also capable of predicting tomorrow's support and resistance up to 3 levels i.e. R1, R2, R3 and S1, S2 and S3. This is the only indicator available in trading view which does the same. Thats the only reason of making a separate indicator.
In this indicator we have also added some symbols to identify the reversal patterns based on candle. This is best if used in 15 min candle. This plots engulfing pattern, shooting star, hammer and bullish and bearish reversals.
Please use it and provide feedback for changes. If i would change anything it would be available automatically anyway.
I have not added Fibonacci Pivots as its generally available in many sites out of box. How ever if you want to code you can use the below formula.
Pivot Point (P) = (High + Low + Close)/3
Support 1 (S1) = P - {.382 * (High - Low)}
Support 2 (S2) = P - {.618 * (High - Low)}
Support 3 (S3) = P - {1 * (High - Low)}
Resistance 1 (R1) = P + {.382 * (High - Low)}
Resistance 2 (R2) = P + {.618 * (High - Low)}
Resistance 3 (R3) = P + {1 * (High - Low)}
リリースノート
Hi All in the current version we have added volume bar candles into this. That indicator is combined here now. In the volume bar also we have fixed capturing the bull run which we were not able to do it before. Code fix done. Please use and provide feedback. If you find any issues tell me in my channel and i will fix it. リリースノート
Removed 3 candle bars now you will see momentum for current bar and live. Hope that will help in u r trading. リリースノート
The Features added are 1. 3 SMA and EMA lines. In total 6. Input text is provided so that people can choose their own SMA and EMA inout values. Default is 20 , 50 and 200 SMA etc.
2. Added labels for daily pivots and Tomorrow's pivot plus Monthly, Weekly and Daily Highs so that you dont need to do additional setting every time. The value will be available with out any additional setting changes.
3. An alert and BUY SELL label is added for FIRST SMA cross over and cross Under. So if the Close of the recent candle crosses first SMA value a BUY and If the Low is sustained below FIRST SMA value a sell signal will be alerted.
リリースノート
Bug Fixed for Daily , weekly and monthly high and lows instead of current one now it displays previous ones as required.リリースノート
Camrilla Details added with required H3, H4, H5. and L3,L4,L5 only. Camrilla level description added as lables. EMA values corrected. SMA values removed.リリースノート
Added tomorrow's Camrilla Pivot values on demand from people. Next version will revise the. plot limit to add more functionalitiesリリースノート
Pivot value was deleted brought it backリリースノート
L5. for. tomorrow is fixed保護スクリプト
このスクリプトのソースコードは非公開で投稿されています。 ただし、制限なく自由に使用できます – 詳細はこちらでご確認ください。
免責事項
この情報および投稿は、TradingViewが提供または推奨する金融、投資、トレード、その他のアドバイスや推奨を意図するものではなく、それらを構成するものでもありません。詳細は利用規約をご覧ください。
保護スクリプト
このスクリプトのソースコードは非公開で投稿されています。 ただし、制限なく自由に使用できます – 詳細はこちらでご確認ください。
免責事項
この情報および投稿は、TradingViewが提供または推奨する金融、投資、トレード、その他のアドバイスや推奨を意図するものではなく、それらを構成するものでもありません。詳細は利用規約をご覧ください。