INVITE-ONLY SCRIPT
更新済 SeikaAlgo–Long/Short Buy/Sell Signal
SeikaAlgo–Long/Short Buy/Sell Signal — Simple, Visual, Reliable Signals
SeikaAlgo makes high-probability trading simple and actionable for everyone—no complex rules, no guesswork. Just follow these 3 steps:
How It Works
1. Watch for Buy/Sell Signals
Buy and Sell signals are printed right on your chart, only after the candle closes—never repaints, never lags. Trade with confidence.
2. Enter at Candle Close
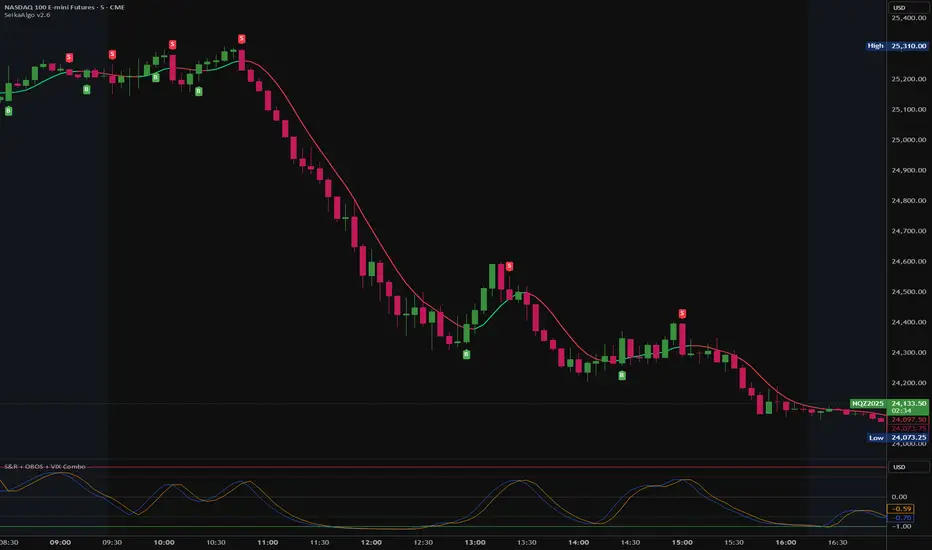
Buy: Enter at the close of a candle when a green “B” label appears and price crosses above the green EMA 9.
Sell: Enter at the close of a candle when a red “S” label appears and price crosses below the red EMA 9.
3. Take Profit
Move your stop loss with each new candle (trailing stop), or use the EMA 9 line to trail stops.
Take profit when price reaches a Daily Fibonacci Level.
Example — 5min SPY
Buy Signal: Green label prints above green EMA 9 after candle closes. Enter at close, stop just below the signal candle’s low.
Sell Signal: Red label prints below red EMA 9 after candle closes. Enter at close, stop just above the signal candle’s high.
Key Features
No Lag, No Repainting: Signals only appear after a candle is complete—so you’re never chasing ghosts.
Clear Visual Cues: Instantly know when to buy, sell, or step aside.
Built-in Trailing Stop Logic: Protect your trades easily.
Works On Any Market/Timeframe: Perfect for stocks, futures, crypto, or forex.
SeikaAlgo is an invite-only indicator.
Add it to your chart, follow the labels and EMA, and trade with confidence—no clutter, no confusion. Simple, visual, reliable.
SeikaAlgo makes high-probability trading simple and actionable for everyone—no complex rules, no guesswork. Just follow these 3 steps:
How It Works
1. Watch for Buy/Sell Signals
Buy and Sell signals are printed right on your chart, only after the candle closes—never repaints, never lags. Trade with confidence.
2. Enter at Candle Close
Buy: Enter at the close of a candle when a green “B” label appears and price crosses above the green EMA 9.
Sell: Enter at the close of a candle when a red “S” label appears and price crosses below the red EMA 9.
3. Take Profit
Move your stop loss with each new candle (trailing stop), or use the EMA 9 line to trail stops.
Take profit when price reaches a Daily Fibonacci Level.
Example — 5min SPY
Buy Signal: Green label prints above green EMA 9 after candle closes. Enter at close, stop just below the signal candle’s low.
Sell Signal: Red label prints below red EMA 9 after candle closes. Enter at close, stop just above the signal candle’s high.
Key Features
No Lag, No Repainting: Signals only appear after a candle is complete—so you’re never chasing ghosts.
Clear Visual Cues: Instantly know when to buy, sell, or step aside.
Built-in Trailing Stop Logic: Protect your trades easily.
Works On Any Market/Timeframe: Perfect for stocks, futures, crypto, or forex.
SeikaAlgo is an invite-only indicator.
Add it to your chart, follow the labels and EMA, and trade with confidence—no clutter, no confusion. Simple, visual, reliable.
リリースノート
SeikaAlgo — Long/Short Buy/Sell SignalsSimple. Visual. Reliable.
Make high-probability trading actionable—no complex rules, no guesswork. Just follow the signal and manage the trade.
How It Works
“B” (Buy) and “S” (Sell) labels print on the chart only after the candle closes—confirmed, no repainting.
*Buy: Enter at the close when a green “B” appears and price crosses above the trend line.
*Sell: Enter at the close when a red “S” appears and price crosses below the trend line.
Trail the position bar-by-bar or along the trend line, then take profit according to your plan.
Dial it in with Signal Filtering Options to hide low-quality setups and match your style.
Level it up: Pair SeikaAlgo with Auto Support & Resistance, Daily Fibonacci Levels, and Overbought & Oversold Zones to stack confluence and boost probability.
Key Features
- Clear Buy & Sell Labels – Straightforward entries right on your chart.
- Trend Line Confirmation – Above the green line favors longs; below the red line favors shorts.
- Visual & Stress-Free – Minimal settings, clean chart, confident decisions.
- Any Market, Any Timeframe – Stocks, crypto, options, futures; from 1-minute to daily and beyond.
- No Lag. No Repaint. – Signals confirm at close and are generated in real time as candles form.
- Auto Support & Resistance (Add-On) – Automatically marks key zones and tags how many times price reacted there—bigger counts = stronger levels.
リリースノート
Strong signal filter logic updateリリースノート
Updateリリースノート
- Added market session filters.
- Added custom time block filter.
- Added neutral OB/OS filter to Strong Signal.
招待専用スクリプト
このスクリプトは作者が承認したユーザーのみアクセス可能です。使用するにはアクセス申請をして許可を得る必要があります。通常は支払い後に承認されます。詳細は下記の作者の指示に従うか、Asa666に直接お問い合わせください。
TradingViewは、作者を完全に信頼し、スクリプトの動作を理解していない限り、有料スクリプトの購入・使用を推奨しません。コミュニティスクリプトには無料のオープンソースの代替が多数あります。
作者の指示
免責事項
この情報および投稿は、TradingViewが提供または推奨する金融、投資、トレード、その他のアドバイスや推奨を意図するものではなく、それらを構成するものでもありません。詳細は利用規約をご覧ください。