INVITE-ONLY SCRIPT
更新済 Multi-Timeframe Trend Analysis [LevelUp]
Multi-Timeframe Trend Analysis was created through a collaborative effort with David Ryan, three-time winner of the U.S. Investing Championship. In addition to working with William O'Neil, founder of Investor's Business Daily, David managed the New USA Growth Fund at William O’Neil + Company.
Identifying Trends and Box Types
It's easy to get caught up with the noise of tracking price movement, bar by bar. This is even more relevant on lower timeframes. When performing trend analysis, it can be very helpful to step back and look at the bigger picture.
To help facilitate visualizing trends, with this indicator you can view higher timeframe data without changing to a new chart:
■ View the weekly trend from a daily chart.
■ View the monthly trend from a weekly chart.
■ View the quarterly trend from a monthly chart.
The weekly chart of GOOGL is shown below. Each box encapsulates one month of trading activity. You can also see the four types of boxes that may be shown: up, down, inside and outside.

Up Box - When a box highest high is above the previous box high, it is considered an up box. The percent change shows the increase from the previous box highest high to the highest high of the current box.
Down Box - When a box lowest low is below the previous box lowest low, it is considered a down box. The percent change shows the decrease from the previous box lowest low to the lowest low of the current box.
Inside Box - When a box highest high is below the previous box highest high, and the box lowest low is greater than the previous box lowest low, it is considered an inside box. Two percent changes are shown. One indicating the decrease from previous box highest high to the highest high of the current box. The other indicating the increase from the previous box lowest low to the lowest low of the current box.
Outside Box - When a box highest high is above the previous box highest high, and the box lowest low is below the previous box lowest low, it is considered an outside box. Two percent changes are shown. One indicating the increase from previous box highest high to the highest high of the current box. The other indicating the decrease from the previous box lowest low to the lowest low of the current box.
Special Note for Outside Boxes: As far as outside boxes and whether they are continuing or changing the trend, it depends on the action of the most recent high or low. The box is considered to be an up box if the highest high is more recent than the lowest low, and vice versa.
How to Use the Indicator
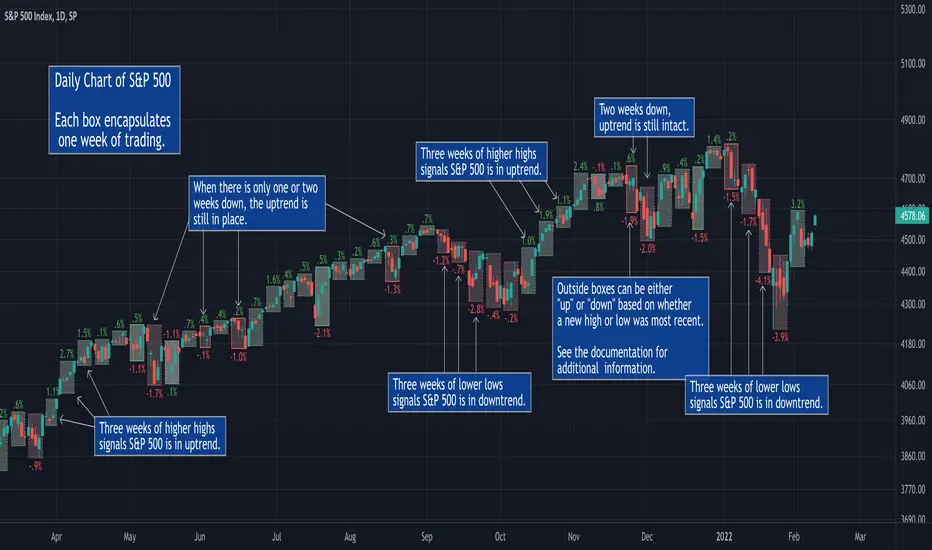
The goal of this indicator is to help spot changes in the trend. Historical price data has shown that movements up/down often occur in threes. By looking for boxes encapsulating higher timeframe moves, we can see when a trend may be changing.
Three Higher Highs - If price movement is sideways or down and is followed by three consecutive higher highs, this may be the start of an uptrend.
Three Lower Lows - If price movement is sideways or up and is followed by three consecutive lower lows, this may be the start of a downtrend.

Percent Change Information
Each box has an optional percent (%) change value. Refer to the image and description below for more information.

Additional Examples


Features
■ View price action trends of higher timeframes without changing the chart timeframe.
■ View percent gain/loss from one box to another.
■ Customize box border and background colors.
■ Show/hide percent change values.
Identifying Trends and Box Types
It's easy to get caught up with the noise of tracking price movement, bar by bar. This is even more relevant on lower timeframes. When performing trend analysis, it can be very helpful to step back and look at the bigger picture.
To help facilitate visualizing trends, with this indicator you can view higher timeframe data without changing to a new chart:
■ View the weekly trend from a daily chart.
■ View the monthly trend from a weekly chart.
■ View the quarterly trend from a monthly chart.
The weekly chart of GOOGL is shown below. Each box encapsulates one month of trading activity. You can also see the four types of boxes that may be shown: up, down, inside and outside.
Up Box - When a box highest high is above the previous box high, it is considered an up box. The percent change shows the increase from the previous box highest high to the highest high of the current box.
Down Box - When a box lowest low is below the previous box lowest low, it is considered a down box. The percent change shows the decrease from the previous box lowest low to the lowest low of the current box.
Inside Box - When a box highest high is below the previous box highest high, and the box lowest low is greater than the previous box lowest low, it is considered an inside box. Two percent changes are shown. One indicating the decrease from previous box highest high to the highest high of the current box. The other indicating the increase from the previous box lowest low to the lowest low of the current box.
Outside Box - When a box highest high is above the previous box highest high, and the box lowest low is below the previous box lowest low, it is considered an outside box. Two percent changes are shown. One indicating the increase from previous box highest high to the highest high of the current box. The other indicating the decrease from the previous box lowest low to the lowest low of the current box.
Special Note for Outside Boxes: As far as outside boxes and whether they are continuing or changing the trend, it depends on the action of the most recent high or low. The box is considered to be an up box if the highest high is more recent than the lowest low, and vice versa.
How to Use the Indicator
The goal of this indicator is to help spot changes in the trend. Historical price data has shown that movements up/down often occur in threes. By looking for boxes encapsulating higher timeframe moves, we can see when a trend may be changing.
Three Higher Highs - If price movement is sideways or down and is followed by three consecutive higher highs, this may be the start of an uptrend.
Three Lower Lows - If price movement is sideways or up and is followed by three consecutive lower lows, this may be the start of a downtrend.
Percent Change Information
Each box has an optional percent (%) change value. Refer to the image and description below for more information.
Additional Examples
Features
■ View price action trends of higher timeframes without changing the chart timeframe.
■ View percent gain/loss from one box to another.
■ Customize box border and background colors.
■ Show/hide percent change values.
リリースノート
Version 2.0■ Add support for Futures and Forex.
リリースノート
Version 3.0■ Minor updates to Settings.
招待専用スクリプト
このスクリプトは作者が承認したユーザーのみアクセス可能です。使用するにはアクセス申請をして許可を得る必要があります。通常は支払い後に承認されます。詳細は下記の作者の指示に従うか、LevelUpToolsに直接お問い合わせください。
TradingViewは、作者を完全に信頼し、スクリプトの動作を理解していない限り、有料スクリプトの購入・使用を推奨しません。コミュニティスクリプトには無料のオープンソースの代替が多数あります。
作者の指示
Purchase the Multi-Timeframe Trend Analysis indicator as part of the Power Trend Pro Toolkit: https://PowerTrendPro.com
Join traders in over 40 countries and LevelUp!
tradingview.com/spaces/LevelUpTools/
tradingview.com/spaces/LevelUpTools/
免責事項
この情報および投稿は、TradingViewが提供または推奨する金融、投資、トレード、その他のアドバイスや推奨を意図するものではなく、それらを構成するものでもありません。詳細は利用規約をご覧ください。