OPEN-SOURCE SCRIPT
BTC SOPR Momentum: Onchain
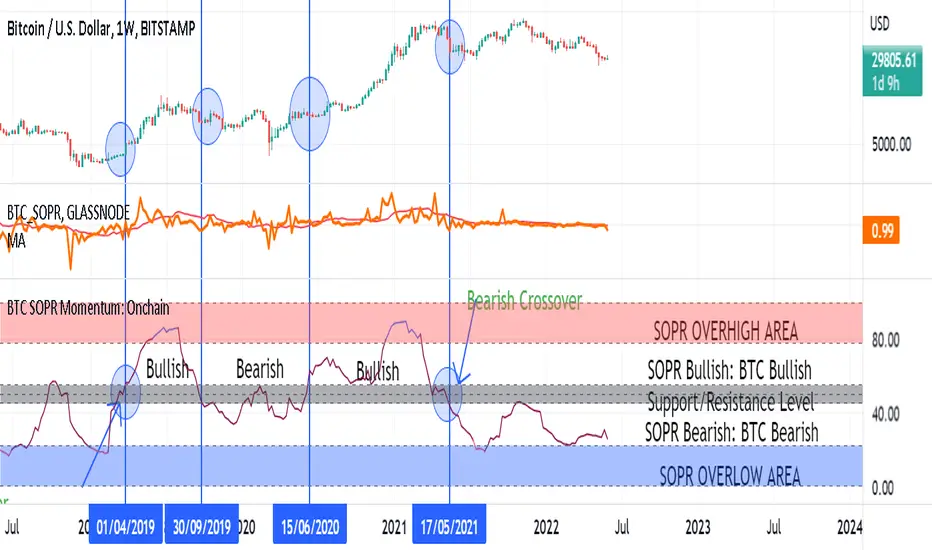
This Onchin metric is based on SOPR data
Use this metric on daily and weekly timeframes:
SOPR:
The Spent Output Profit Ratio (SOPR) is computed by dividing the realized value (in USD) divided by the value at creation (USD) of a spent output. Or simply: price sold / price paid. Renato Shirakashi created this metric. When SOPR > 1, it means that the owners of the spent outputs are in profit at the time of the transaction; otherwise, they are at a loss. You can find "SOPR" in tradingview indicators
BTC SOPR Momentum: Onchain
This metric is based on SOPR Momentum. I made some changes to it so that its momentum can be checked.
Interpretation:
If the indicator is above the gray level of resistance/support, bitcoin has an uptrend and Bullish bias
If the indicator is below the resistance/ support level, bitcoin has a downtrend and Bearish Bias
Crossup the gray level is a long signal
Cross-down the gray level is a shorts signal
Entering and exit of the indicator to the overhigh area means creating a top
Entering and leaving the indicator to the overflow area means creating a bottom
オープンソーススクリプト
TradingViewの精神に則り、このスクリプトの作者はコードをオープンソースとして公開してくれました。トレーダーが内容を確認・検証できるようにという配慮です。作者に拍手を送りましょう!無料で利用できますが、コードの再公開はハウスルールに従う必要があります。
免責事項
この情報および投稿は、TradingViewが提供または推奨する金融、投資、トレード、その他のアドバイスや推奨を意図するものではなく、それらを構成するものでもありません。詳細は利用規約をご覧ください。
オープンソーススクリプト
TradingViewの精神に則り、このスクリプトの作者はコードをオープンソースとして公開してくれました。トレーダーが内容を確認・検証できるようにという配慮です。作者に拍手を送りましょう!無料で利用できますが、コードの再公開はハウスルールに従う必要があります。
免責事項
この情報および投稿は、TradingViewが提供または推奨する金融、投資、トレード、その他のアドバイスや推奨を意図するものではなく、それらを構成するものでもありません。詳細は利用規約をご覧ください。