INVITE-ONLY SCRIPT
更新済 NKP Trend Trader V1
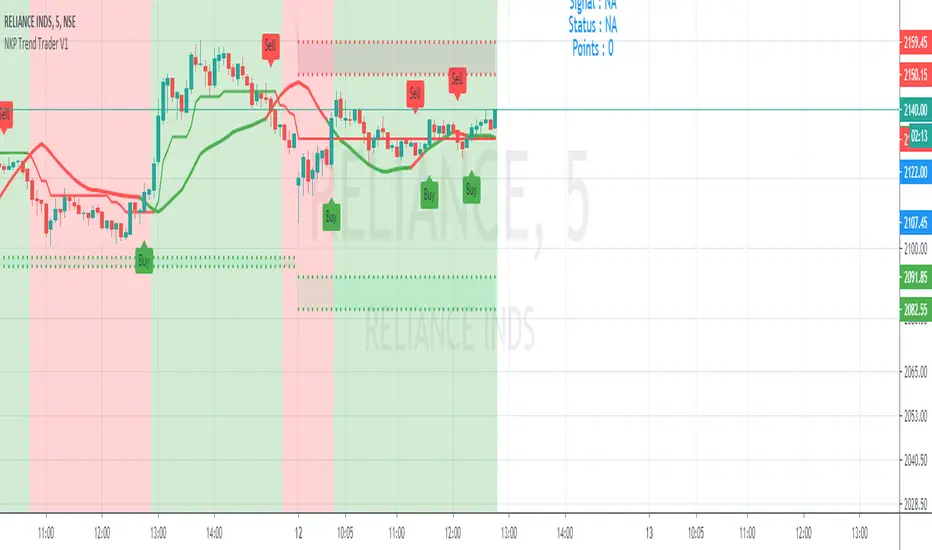
NKP Trend Trader is an indicator. It will plot buy / sell signal in live market based on custom calculated information about entry points at close of the candle. Buy/ Sell signal is the best entry point but you can enter at the next candle.
we can see the Trend line and signals like Buy/Sell - 5 min candle (Intraday trading)
we can see the trend line formed with two colors(Red or Green). If the Trend line color change from red to green then buy signal will generate with green color label with "Buy" text once see the buy signal then go for long in the next candle open.
If the Trend line color change from green to red then sell signal will generate with red color label with "Sell" text once see the sell signal then go for short in the next candle open.
How does it work?
buy - Take the buy order in the next candle open after Buy signal and book profit when signal change to sell( trend line color changes from green to red)
sell - Take the sell order in the next candle open after Sell signal and book profit when signal change to buy( trend line color changes from red to green)
What are the signals?
Yes it will generate the buy/sell signals in the live market
these signal will plot Green color label with "Buy"/Red color label with "Sell" based on signal.
Can we set the Alert on this?
Yes, we can set the alert based on the signals
Two custom alerts - NKP Buy , NKP Sell
IMPORTANT: this script does not generate exit signals and those should be find using money management rules or else. Perfectly catches long runs in trends at all underlings (stocks, indexes ) at 5 min time frame. Lower/High period gives more incorrect signals and shorter runs on below 5 min period , higher period gives you late entry and less. Of course it gives false signals from time to time but fortunately it makes a correction very fast.
Try it! Good luck and good trading!
"Use the link below to obtain access to this indicator" or "PM us to obtain access."
リリースノート
Trend line calculations are changed to get the accurate callsリリースノート
signal logic updatedリリースノート
trend line got corrected(no repaint)リリースノート
signal logic changed to get good accuracyリリースノート
Main trend line formation logic changed to no repaintリリースノート
Instead of main trend line make it to trend background color リリースノート
adjusted the signal accuracy.リリースノート
new trend line added to identify the falls signalsリリースノート
Signal Status text added in the chart.リリースノート
alignment the textリリースノート
trade status - momentum strength addedリリースノート
chart correctedリリースノート
chart scaling bug fixed リリースノート
daily buyer/seller zones addedリリースノート
Added the Gap up /down with mother candle formation strategy with this indicator.リリースノート
updated招待専用スクリプト
このスクリプトは作者が承認したユーザーのみアクセス可能です。使用するにはアクセス申請をして許可を得る必要があります。通常は支払い後に承認されます。詳細は下記の作者の指示に従うか、NKPTechnicalTraderに直接お問い合わせください。
TradingViewは、作者を完全に信頼し、スクリプトの動作を理解していない限り、有料スクリプトの購入・使用を推奨しません。コミュニティスクリプトには無料のオープンソースの代替が多数あります。
作者の指示
免責事項
この情報および投稿は、TradingViewが提供または推奨する金融、投資、トレード、その他のアドバイスや推奨を意図するものではなく、それらを構成するものでもありません。詳細は利用規約をご覧ください。
招待専用スクリプト
このスクリプトは作者が承認したユーザーのみアクセス可能です。使用するにはアクセス申請をして許可を得る必要があります。通常は支払い後に承認されます。詳細は下記の作者の指示に従うか、NKPTechnicalTraderに直接お問い合わせください。
TradingViewは、作者を完全に信頼し、スクリプトの動作を理解していない限り、有料スクリプトの購入・使用を推奨しません。コミュニティスクリプトには無料のオープンソースの代替が多数あります。
作者の指示
免責事項
この情報および投稿は、TradingViewが提供または推奨する金融、投資、トレード、その他のアドバイスや推奨を意図するものではなく、それらを構成するものでもありません。詳細は利用規約をご覧ください。