PROTECTED SOURCE SCRIPT
Combined EMA + RSI + Stochastic RSI
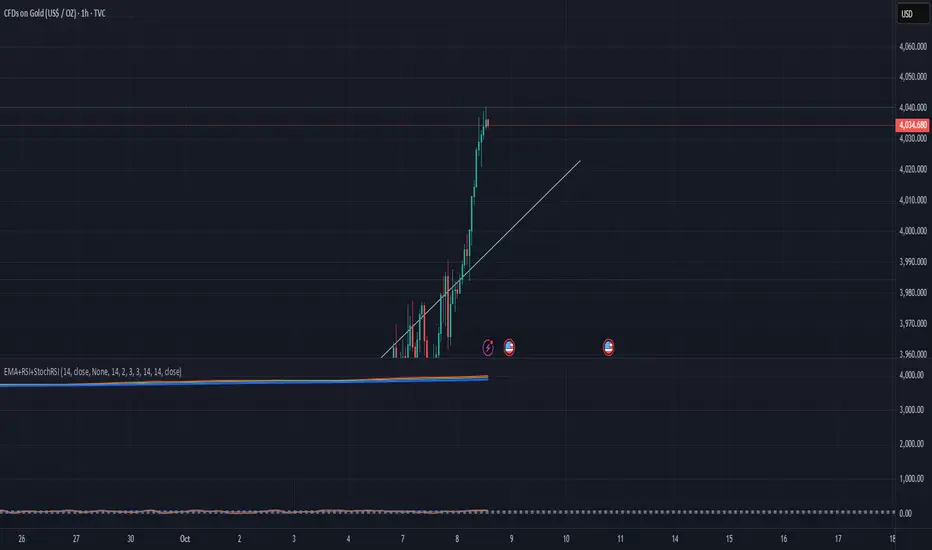
⚙️ Combined EMA + RSI + Stochastic RSI Indicator
This indicator merges three powerful technical tools — EMA, RSI, and Stochastic RSI — to help traders identify trend direction, strength, and potential reversal zones all in one view.
EMA (Exponential Moving Average):
Shows the overall market trend. When price stays above the EMA, it signals bullish momentum; below the EMA indicates bearish pressure.
RSI (Relative Strength Index):
Measures momentum and overbought/oversold conditions, helping identify when a trend may be losing strength.
Stochastic RSI:
Adds a faster, more sensitive oscillator, giving early signals of potential reversals or pullbacks within the main trend.
保護スクリプト
このスクリプトのソースコードは非公開で投稿されています。 しかし、無料かつ制限なしでご利用いただけます ― 詳細についてはこちらをご覧ください。
免責事項
これらの情報および投稿は、TradingViewが提供または保証する金融、投資、取引、またはその他の種類のアドバイスや推奨を意図したものではなく、またそのようなものでもありません。詳しくは利用規約をご覧ください。
保護スクリプト
このスクリプトのソースコードは非公開で投稿されています。 しかし、無料かつ制限なしでご利用いただけます ― 詳細についてはこちらをご覧ください。
免責事項
これらの情報および投稿は、TradingViewが提供または保証する金融、投資、取引、またはその他の種類のアドバイスや推奨を意図したものではなく、またそのようなものでもありません。詳しくは利用規約をご覧ください。