PROTECTED SOURCE SCRIPT
Market Divergence (Line version) ©MBYLAB
Good morning.
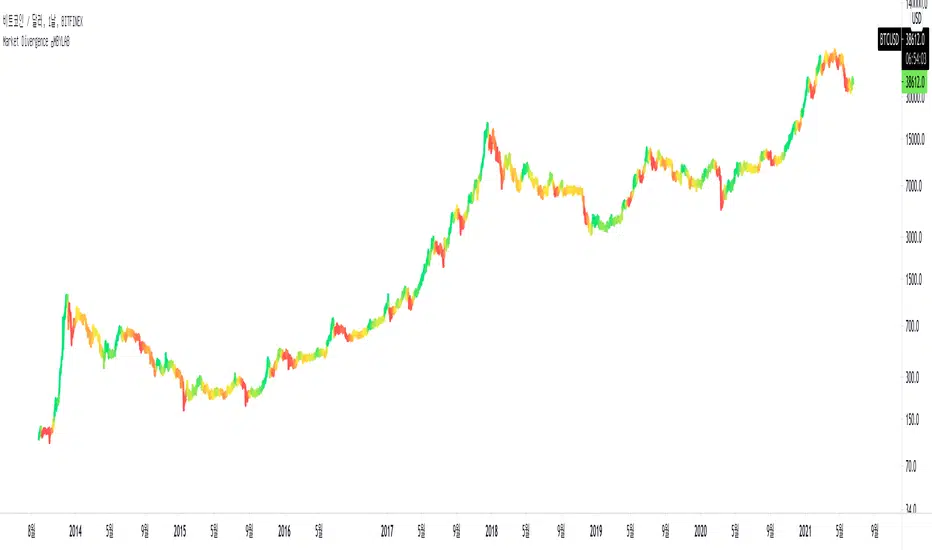
This indicator measures the distance between the moving average line and the current price position, so you can check the price divergence.
logic
In general, when the closing price breaks below the moving average and closes, it can be interpreted as downward divergence.
Based on the logic described above, this indicator will have a darker color as the current price position is further away from the set moving average.
When this indicator starts changing from red to yellow, it can be interpreted that the trend is reversing.(Bearish -> Bullish)
How to use
First, set the existing candle chart in the upper left to invisible and then apply the corresponding indicator.
Anyone can use this indicator, no special conditions are required.
保護スクリプト
このスクリプトのソースコードは非公開で投稿されています。 ただし、制限なく自由に使用できます – 詳細はこちらでご確認ください。
Hi, im Quant from KR
免責事項
この情報および投稿は、TradingViewが提供または推奨する金融、投資、トレード、その他のアドバイスや推奨を意図するものではなく、それらを構成するものでもありません。詳細は利用規約をご覧ください。
免責事項
この情報および投稿は、TradingViewが提供または推奨する金融、投資、トレード、その他のアドバイスや推奨を意図するものではなく、それらを構成するものでもありません。詳細は利用規約をご覧ください。