INVITE-ONLY SCRIPT
Varma Fractal TEMA Indicator
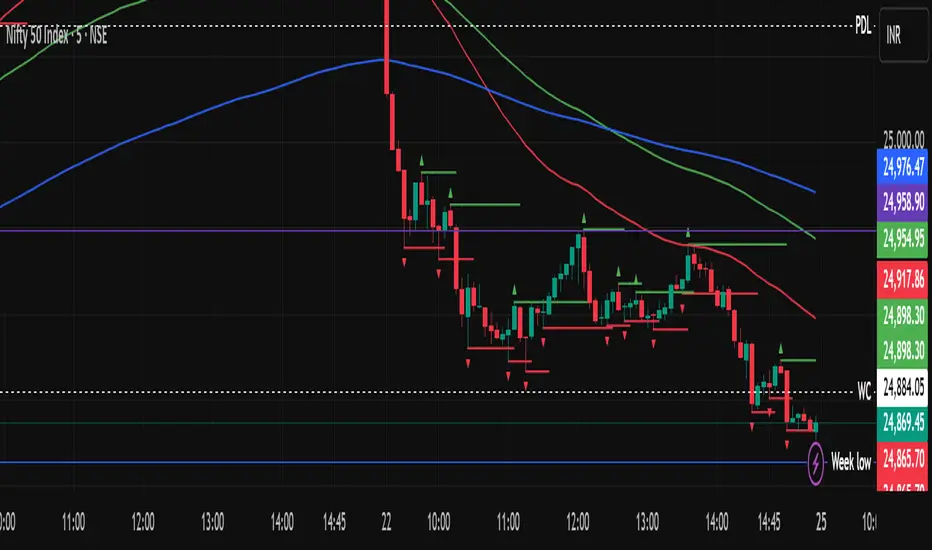
The Indicator uses Fractals and Three EMAs. A fractal is a repeating price pattern, typically consisting of five candlesticks, used to identify potential trend reversals or continuations. A bullish fractal suggests a possible upward price movement, while a bearish fractal indicates a potential downward trend. These patterns, popularized by Bill Williams, can be found across different timeframes and are considered a key part of his technical analysis system. Every Fractal line acts as an immediate support or resistance. The use of three EMAs in trading is well known. One can make own strategies with them.
招待専用スクリプト
このスクリプトは作者が承認したユーザーのみアクセス可能です。使用するにはアクセス申請をして許可を得る必要があります。通常は支払い後に承認されます。詳細は下記の作者の指示に従うか、varmasudhakarに直接お問い合わせください。
TradingViewは、作者を完全に信頼し、スクリプトの動作を理解していない限り、有料スクリプトの購入・使用を推奨しません。コミュニティスクリプトには無料のオープンソースの代替が多数あります。
作者の指示
ENTRY FOR LONG:(When the price is above 200 EMA and above 20 EMA line :Source: High in settings) *At the close of the green candle, which crosses the nearest green fractal level
ENTRY FOR SHORT: (When the price is below the 200 EMA and 20 EMA) in reverse
免責事項
この情報および投稿は、TradingViewが提供または推奨する金融、投資、トレード、その他のアドバイスや推奨を意図するものではなく、それらを構成するものでもありません。詳細は利用規約をご覧ください。