INVITE-ONLY SCRIPT
更新済 LONG - MasterChartsTrading
LONG - MasterChartsTrading
リリースノート
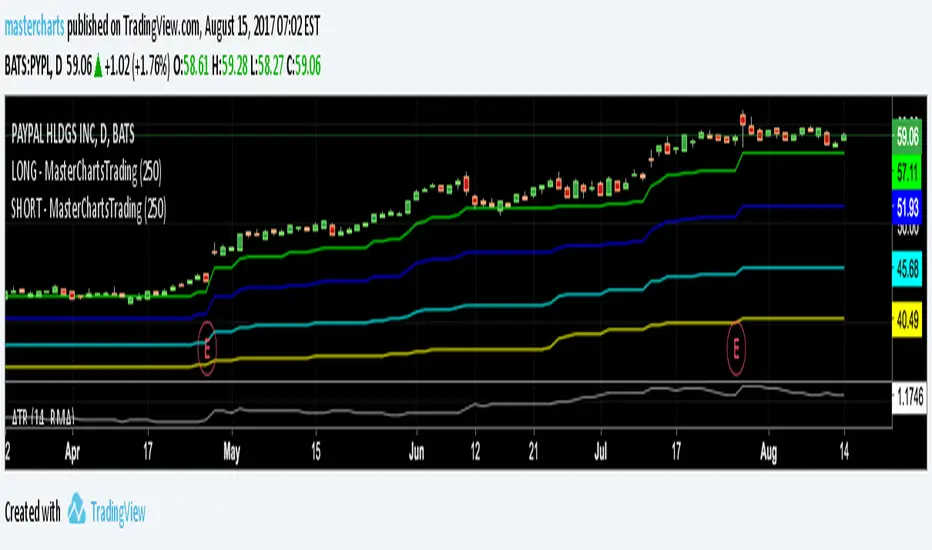
MasterChartsTrading Price Action Indicators show good price levels to enter or exit at trade. The Blue indicator line serves as a Bullish Trend setter.
If your instrument closes above the Blue line, we think about going Long (buying).
For commodities and Forex, when your trading instrument closes below the Red line, we think about Shorting (selling).
For Stocks, I prefer to use the Yellow line as my Bearish Trend setter (on Daily charts ).
Find out more! Send Private Mail (PM) to mastercharts
招待専用スクリプト
このスクリプトは作者が承認したユーザーのみアクセス可能です。使用するにはアクセス申請をして許可を得る必要があります。通常は支払い後に承認されます。詳細は下記の作者の指示に従うか、masterchartsに直接お問い合わせください。
TradingViewは、作者を完全に信頼し、スクリプトの動作を理解していない限り、有料スクリプトの購入・使用を推奨しません。コミュニティスクリプトには無料のオープンソースの代替が多数あります。
作者の指示
FREE Trial of These Indicators. Sign-Up for access here: masterchartstrading.com/store/c1/Featured_Products.html
Visit my financial blog & get alerts : masterchartstrading.com/blog
@mastercharts
Visit my financial blog & get alerts : masterchartstrading.com/blog
@mastercharts
免責事項
この情報および投稿は、TradingViewが提供または推奨する金融、投資、トレード、その他のアドバイスや推奨を意図するものではなく、それらを構成するものでもありません。詳細は利用規約をご覧ください。