PROTECTED SOURCE SCRIPT
Universally Applicable Valuation Indicator
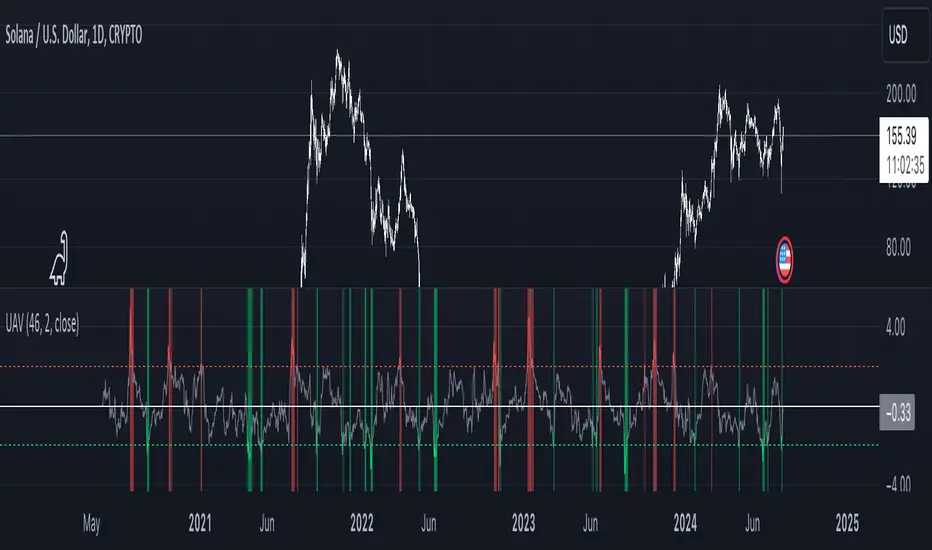
The UAV indicator utilizes a z-score analysis of the Relative Strength Index (RSI) to offer insights into current market conditions.
By comparing the current z-score to its historical distribution, the indicator generates signals that highlight potential overbought or oversold areas.
It features clear visual cues, with color changes occurring as the score crosses plotted standard deviation lines, making it easier to identify potential entry and exit points across all assets and timeframes.
保護スクリプト
このスクリプトのソースコードは非公開で投稿されています。 ただし、制限なく自由に使用できます – 詳細はこちらでご確認ください。
免責事項
この情報および投稿は、TradingViewが提供または推奨する金融、投資、トレード、その他のアドバイスや推奨を意図するものではなく、それらを構成するものでもありません。詳細は利用規約をご覧ください。
免責事項
この情報および投稿は、TradingViewが提供または推奨する金融、投資、トレード、その他のアドバイスや推奨を意図するものではなく、それらを構成するものでもありません。詳細は利用規約をご覧ください。