PROTECTED SOURCE SCRIPT
Awesome Oscillator (AO) - Two EMA / SMA

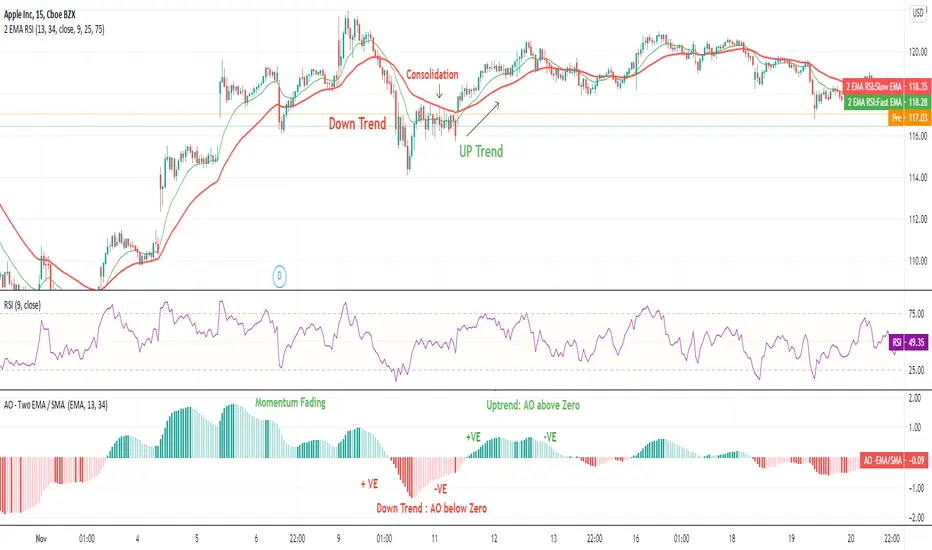
Awesome Oscillator with EMA indicator plots Awesome Oscillator indicator (Bill M. Williams) on Two Exponential Moving Averages.
The value of the Awesome Oscillator indicator is calculated as the difference between moving averages over these two time frames.
Rather than using closing prices, though, these moving averages use the midpoints of the bars (i.e. halfway between the high and the low).
Midpoint = (H + L)/2
AO = Fast Moving Average - Slow Moving Average
The indicator subtracts the Fast Moving Average from the Slow Moving Average and plots this value as a histogram.
It measures the market momentum with the aim to detect potential trend direction or trend reversals and momentum.
How to read the Indicator ?
- When AO is greater than zero line, it is an uptrend. When AO is less than zero it is a downtrend.Rising AO indicates momentum intact. Falling AO indicates momentum loosing the steam.When AO is nearing zero, one can expect the trend reversal & big move in opposite direction in trending market.
保護スクリプト
このスクリプトのソースコードは非公開で投稿されています。 ただし、制限なく自由に使用できます – 詳細はこちらでご確認ください。
免責事項
この情報および投稿は、TradingViewが提供または推奨する金融、投資、トレード、その他のアドバイスや推奨を意図するものではなく、それらを構成するものでもありません。詳細は利用規約をご覧ください。
保護スクリプト
このスクリプトのソースコードは非公開で投稿されています。 ただし、制限なく自由に使用できます – 詳細はこちらでご確認ください。
免責事項
この情報および投稿は、TradingViewが提供または推奨する金融、投資、トレード、その他のアドバイスや推奨を意図するものではなく、それらを構成するものでもありません。詳細は利用規約をご覧ください。