INVITE-ONLY SCRIPT
felci
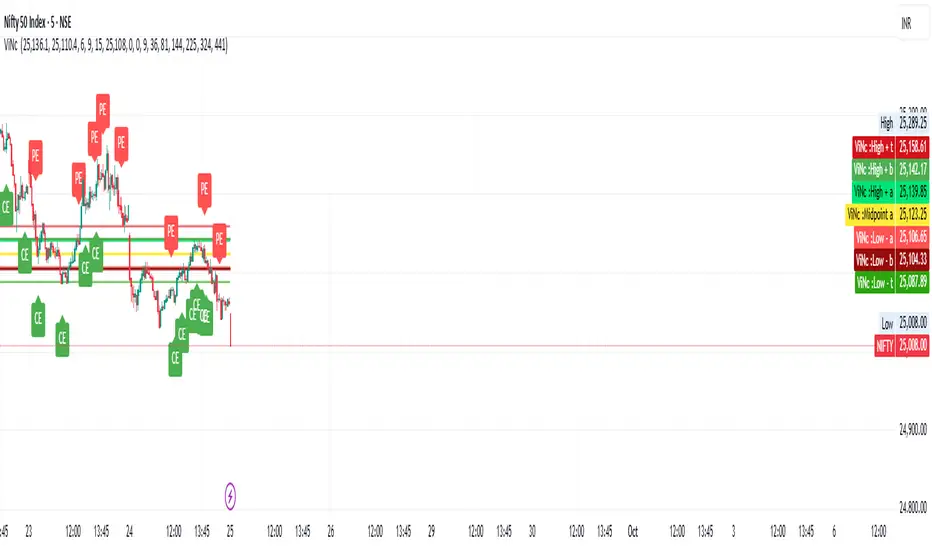
The first row shows HIGH values of NIFTY.
The second row shows LOW values of NIFTY.
Some values are negative (like -2058, -300, -486)—these could indicate changes or differences rather than absolute index values.
The table seems color-coded in the image: green, orange, and light colors—probably to highlight ranges or thresholds.
The second row shows LOW values of NIFTY.
Some values are negative (like -2058, -300, -486)—these could indicate changes or differences rather than absolute index values.
The table seems color-coded in the image: green, orange, and light colors—probably to highlight ranges or thresholds.
招待専用スクリプト
このスクリプトは作者が承認したユーザーのみアクセス可能です。使用するにはアクセス申請をして許可を得る必要があります。通常は支払い後に承認されます。詳細は下記の作者の指示に従うか、vincent_march88に直接お問い合わせください。
TradingViewは、作者を完全に信頼し、スクリプトの動作を理解していない限り、有料スクリプトの購入・使用を推奨しません。コミュニティスクリプトには無料のオープンソースの代替が多数あります。
作者の指示
give request and pay 1 month subscription
免責事項
この情報および投稿は、TradingViewが提供または推奨する金融、投資、トレード、その他のアドバイスや推奨を意図するものではなく、それらを構成するものでもありません。詳細は利用規約をご覧ください。