PROTECTED SOURCE SCRIPT
Traders Trend Strategy
Trader's Trend
This indicator basicly using 4 different calculations average.
And you can see this average as line on this script.
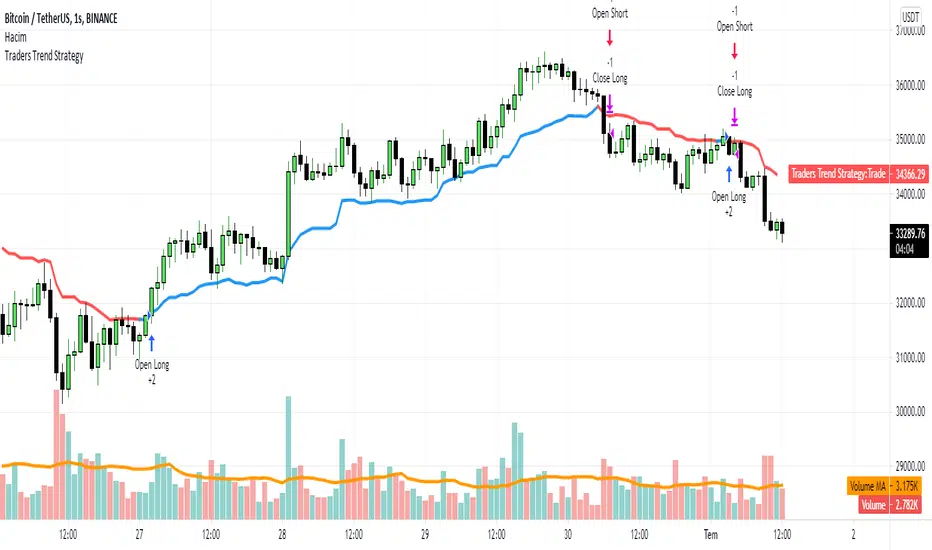
This line has 2 functions
1. Buy and Sell Strategy
-İf the line colored BLUE this means you can BUY (Long)
-İf the line colored RED this means you can SELL (Short)

As you can see the picture you can buy-sell and long-short with this line
2. Support and Resistance Function
You can use the line as resistance and support.
You can see when you can LONG and when you can SHORT with this strategy.
This indicator basicly using 4 different calculations average.
And you can see this average as line on this script.
This line has 2 functions
1. Buy and Sell Strategy
-İf the line colored BLUE this means you can BUY (Long)
-İf the line colored RED this means you can SELL (Short)
As you can see the picture you can buy-sell and long-short with this line
2. Support and Resistance Function
You can use the line as resistance and support.
You can see when you can LONG and when you can SHORT with this strategy.
保護スクリプト
このスクリプトのソースコードは非公開で投稿されています。 ただし、制限なく自由に使用できます – 詳細はこちらでご確認ください。
免責事項
この情報および投稿は、TradingViewが提供または推奨する金融、投資、トレード、その他のアドバイスや推奨を意図するものではなく、それらを構成するものでもありません。詳細は利用規約をご覧ください。
保護スクリプト
このスクリプトのソースコードは非公開で投稿されています。 ただし、制限なく自由に使用できます – 詳細はこちらでご確認ください。
免責事項
この情報および投稿は、TradingViewが提供または推奨する金融、投資、トレード、その他のアドバイスや推奨を意図するものではなく、それらを構成するものでもありません。詳細は利用規約をご覧ください。