PROTECTED SOURCE SCRIPT
Statistical Arbitrage Right Leg
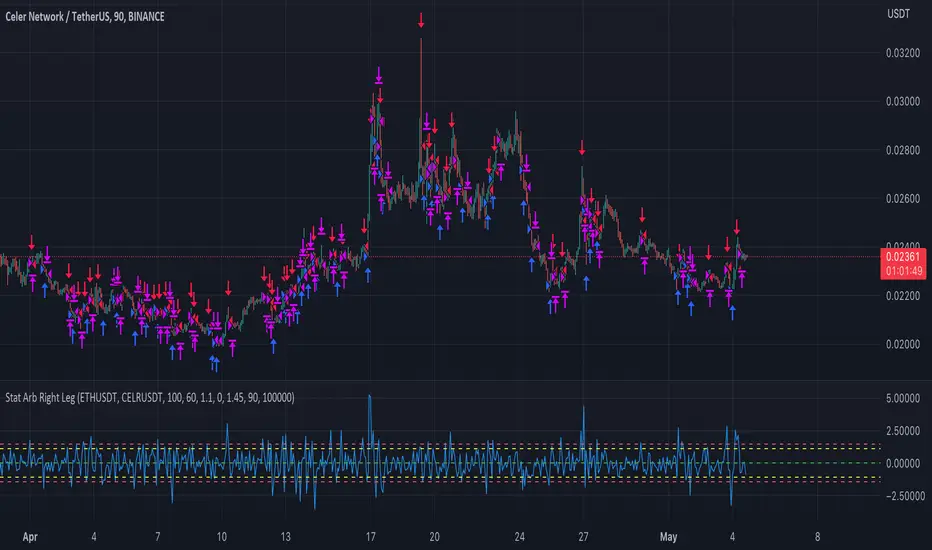
Statistical Arbitrage, this is the right leg strategy signal.
You should find "Statistical Arbitrage Left Leg (Symbol 1)" this strategy for the opposite leg (Left Leg),
In order to full hedge the position exposure risk, and profit on the spread convergence.
Statistical arbitrage is a quantitative trading strategy that seeks to exploit pricing discrepancies in financial markets based on statistical models and analysis. It involves using mathematical models and statistical techniques to identify and take advantage of mispricings between related financial assets.
In statistical arbitrage, traders use sophisticated algorithms to identify pairs or groups of financial assets that are expected to move in tandem based on historical correlations. They then look for deviations from these historical patterns in order to generate profitable trades. For example, a trader might identify a pair of stocks that have historically moved together, but are currently priced such that one is significantly cheaper than the other. The trader would then buy the cheaper stock and simultaneously sell the more expensive one, hoping to profit when the prices converge.
Statistical arbitrage is a popular trading strategy among hedge funds and other institutional investors, who have access to large amounts of data and the computational resources necessary to analyze it. However, it requires significant expertise in statistics, mathematics, and programming, as well as access to advanced analytical tools and data sources.
保護スクリプト
このスクリプトのソースコードは非公開で投稿されています。 ただし、制限なく自由に使用できます – 詳細はこちらでご確認ください。
在交易的世界裡沒有真理,在上帝的眼中也沒有隨機。
免責事項
この情報および投稿は、TradingViewが提供または推奨する金融、投資、トレード、その他のアドバイスや推奨を意図するものではなく、それらを構成するものでもありません。詳細は利用規約をご覧ください。
保護スクリプト
このスクリプトのソースコードは非公開で投稿されています。 ただし、制限なく自由に使用できます – 詳細はこちらでご確認ください。
在交易的世界裡沒有真理,在上帝的眼中也沒有隨機。
免責事項
この情報および投稿は、TradingViewが提供または推奨する金融、投資、トレード、その他のアドバイスや推奨を意図するものではなく、それらを構成するものでもありません。詳細は利用規約をご覧ください。