INVITE-ONLY SCRIPT
CVD Line + EMA
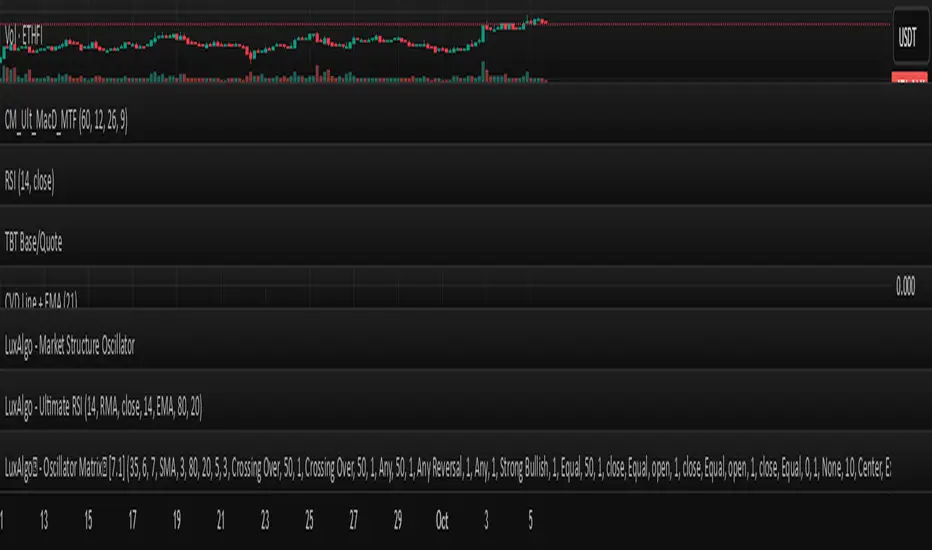
This indicator visualizes the Cumulative Volume Delta (CVD) as a line and overlays an Exponential Moving Average (EMA, default length 21) on the CVD. The CVD estimates buy/sell volume using candle direction, accumulating volume when price moves up or down. The EMA helps smooth the CVD, quickly signaling directional shifts that can indicate potential trend changes. The line turns green when CVD holds above its EMA (suggesting bullish pressure) and red when below (suggesting bearish pressure).
Settings allow users to customize the EMA period to suit different timeframes or trading strategies. The script is intended for educational purposes and is released under the Mozilla Public License 2.0. For best results, use in conjunction with other analysis and risk management tools.
Settings allow users to customize the EMA period to suit different timeframes or trading strategies. The script is intended for educational purposes and is released under the Mozilla Public License 2.0. For best results, use in conjunction with other analysis and risk management tools.
招待専用スクリプト
こちらのスクリプトにアクセスできるのは投稿者が承認したユーザーだけです。投稿者にリクエストして使用許可を得る必要があります。通常の場合、支払い後に許可されます。詳細については、以下、作者の指示をお読みになるか、MFH_BMに直接ご連絡ください。
スクリプトの機能を理解し、その作者を全面的に信頼しているのでなければ、お金を支払ってまでそのスクリプトを利用することをTradingViewとしては「非推奨」としています。コミュニティスクリプトの中で、その代わりとなる無料かつオープンソースのスクリプトを見つけられる可能性もあります。
作者の指示
This indicator plots the Cumulative Volume Delta (CVD) and overlays an adjustable Exponential Moving Average (EMA, default length 21) on it.
Adjust the EMA length in the settings as needed for your timeframe or asset.
免責事項
これらの情報および投稿は、TradingViewが提供または保証する金融、投資、取引、またはその他の種類のアドバイスや推奨を意図したものではなく、またそのようなものでもありません。詳しくは利用規約をご覧ください。