OPEN-SOURCE SCRIPT
更新済 Speculation Ratio Territory
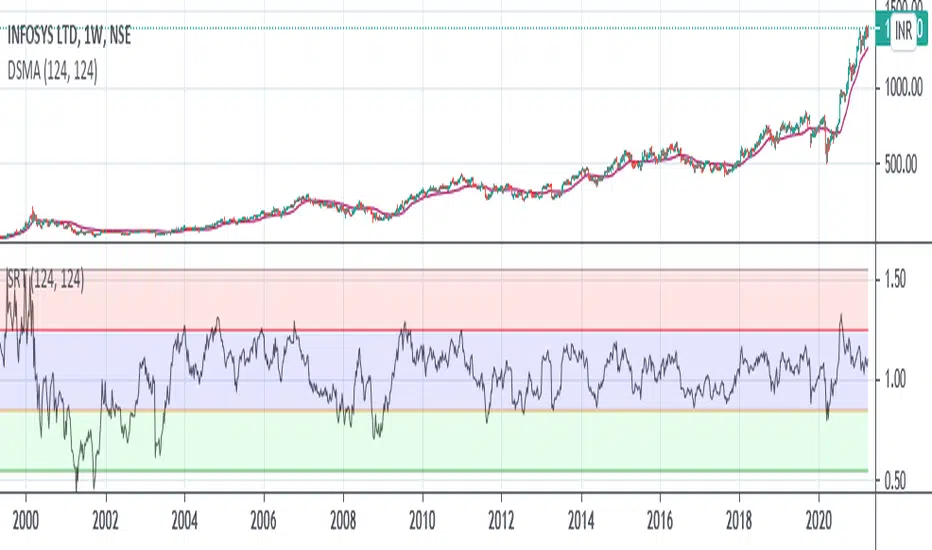
Speculation Ratio Territory
It is used to find the Index Top or Bottom which will define the buying and selling zone.
It should be checked on a weekly chart.
Example : As Nifty Trades around 248 days in a year.
So, 248/2 = 124
Now Use 124 DSMA on weekly chart.
Suppose Nifty 124 DSMA is @16000 and Current Market Price is 16500, then
SRT = 16500/16000 = 1.031
Top SRT of Nifty = 1.55
Bottom SRT of Nifty = 0.55
One should start investing when SRT value is between 0.55 to 0.75
And exit when SRT value is between 1.30 to 1.55
Credit for DSMA Script : //Deviation Scaled Moving Average by John Ehlers
It is used to find the Index Top or Bottom which will define the buying and selling zone.
It should be checked on a weekly chart.
Example : As Nifty Trades around 248 days in a year.
So, 248/2 = 124
Now Use 124 DSMA on weekly chart.
Suppose Nifty 124 DSMA is @16000 and Current Market Price is 16500, then
SRT = 16500/16000 = 1.031
Top SRT of Nifty = 1.55
Bottom SRT of Nifty = 0.55
One should start investing when SRT value is between 0.55 to 0.75
And exit when SRT value is between 1.30 to 1.55
- 0.55 to 0.75 --> ENTER (Green Zone)
- 0.75 to 1.30 --> HOLD (Blue Zone)
- 1.30 to 1.55 --> EXIT (Red Zone)
Credit for DSMA Script : //Deviation Scaled Moving Average by John Ehlers
リリースノート
Update : The concept of SRT is inspired by nkstocktalk , you can find the SRT details here as well : twitter.com"/"NKStockTalk1"/"status"/"1378537449010327553オープンソーススクリプト
TradingViewの精神に則り、このスクリプトの作者はコードをオープンソースとして公開してくれました。トレーダーが内容を確認・検証できるようにという配慮です。作者に拍手を送りましょう!無料で利用できますが、コードの再公開はハウスルールに従う必要があります。
免責事項
この情報および投稿は、TradingViewが提供または推奨する金融、投資、トレード、その他のアドバイスや推奨を意図するものではなく、それらを構成するものでもありません。詳細は利用規約をご覧ください。
オープンソーススクリプト
TradingViewの精神に則り、このスクリプトの作者はコードをオープンソースとして公開してくれました。トレーダーが内容を確認・検証できるようにという配慮です。作者に拍手を送りましょう!無料で利用できますが、コードの再公開はハウスルールに従う必要があります。
免責事項
この情報および投稿は、TradingViewが提供または推奨する金融、投資、トレード、その他のアドバイスや推奨を意図するものではなく、それらを構成するものでもありません。詳細は利用規約をご覧ください。