OPEN-SOURCE SCRIPT
Bitcoin Cycle
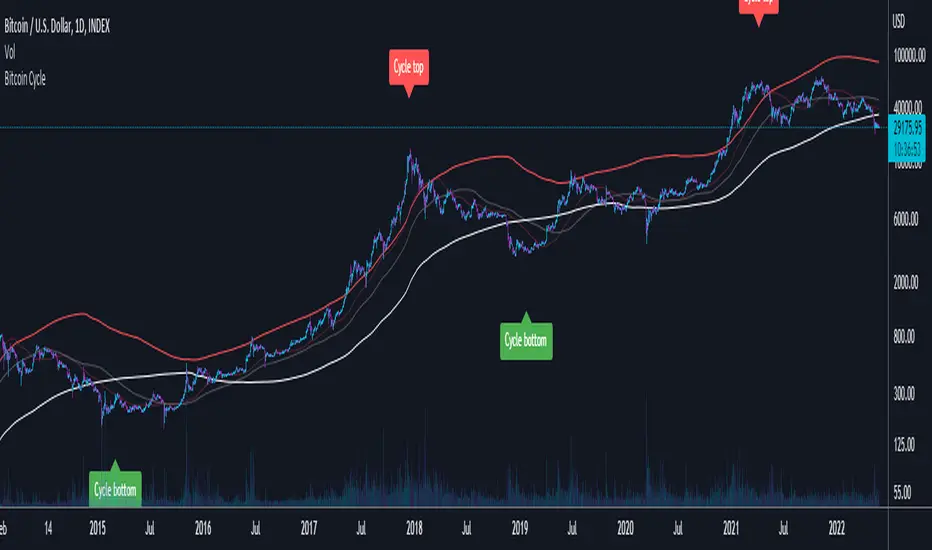
This script displays 4 different Moving Averages:
For the last cycles: once the 2 year MA crossed the 232 Day MA, it marked the cycle bottom within a few days and once the 1 year MA (x2) crossed the 116 Day MA, it marked the cycle top within a few days.
It is interesting to note that both 365/116 and 730/232 equal 3.1465, which is very close to Pi (3.142). It is actually the closest we can get to Pi when dividing 365 by another whole number.
- 2 Year Moving Average (White)
- 1 Year Moving Average (Doubled in value, Red)
- 116 Day Moving Average (Transparent, Red)
- 232 Day Moving Average (Transparent, White)
For the last cycles: once the 2 year MA crossed the 232 Day MA, it marked the cycle bottom within a few days and once the 1 year MA (x2) crossed the 116 Day MA, it marked the cycle top within a few days.
It is interesting to note that both 365/116 and 730/232 equal 3.1465, which is very close to Pi (3.142). It is actually the closest we can get to Pi when dividing 365 by another whole number.
オープンソーススクリプト
TradingViewの精神に則り、このスクリプトの作者はコードをオープンソースとして公開してくれました。トレーダーが内容を確認・検証できるようにという配慮です。作者に拍手を送りましょう!無料で利用できますが、コードの再公開はハウスルールに従う必要があります。
免責事項
この情報および投稿は、TradingViewが提供または推奨する金融、投資、トレード、その他のアドバイスや推奨を意図するものではなく、それらを構成するものでもありません。詳細は利用規約をご覧ください。
オープンソーススクリプト
TradingViewの精神に則り、このスクリプトの作者はコードをオープンソースとして公開してくれました。トレーダーが内容を確認・検証できるようにという配慮です。作者に拍手を送りましょう!無料で利用できますが、コードの再公開はハウスルールに従う必要があります。
免責事項
この情報および投稿は、TradingViewが提供または推奨する金融、投資、トレード、その他のアドバイスや推奨を意図するものではなく、それらを構成するものでもありません。詳細は利用規約をご覧ください。