INVITE-ONLY SCRIPT
[astropark] trade yesterday range

Dear followers,
today a nice scalping tool for day trading on low time frames (1-3-5 minutes)!
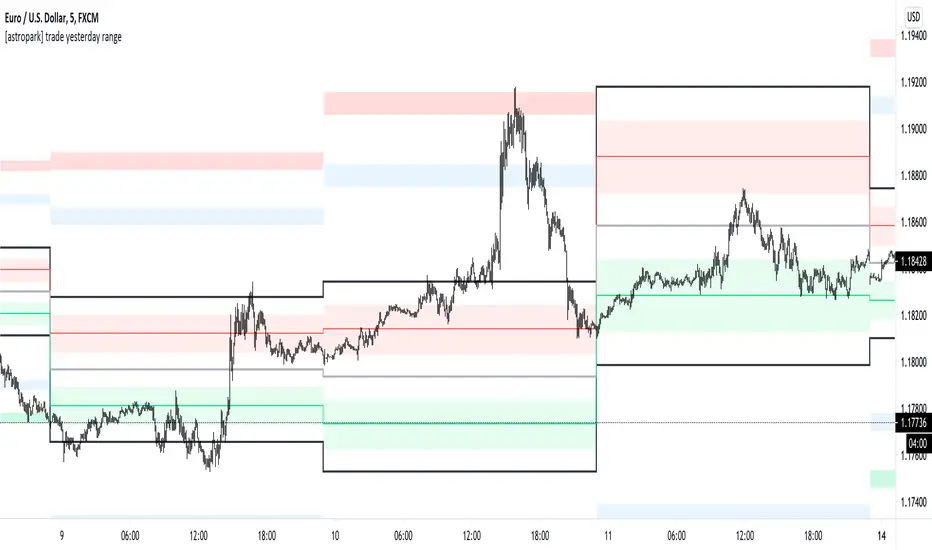
Each day the indicator will print some important levels and ranges related to the trading day before:
Trading levels is one of most effective trading tecniques:
Here you can see the levels described above and basic usage in a consolidation trading day:

A trader who wants to be a winner must understand that money and risk management are very important, so manage your position size and always have a stop loss in your trades.
Here you can see many examples on how to use this indicator.
Triple top on yesterday range high: perfect short setup (5 take profits targets in the example)

Resistance levels broken: long setup on bullish retest (2 take profits targets in the example)

Double top and support broken: 2 short setups (2 and 3 take profits targets in the example)

Here some examples how to basically use the indicator in a consolidation trading day: short (sell) resistance levels, long (buy) support levels


This is a premium indicator, so send me a private message in order to get access to this script.
today a nice scalping tool for day trading on low time frames (1-3-5 minutes)!
Each day the indicator will print some important levels and ranges related to the trading day before:
- yesterday high (black line)
- yesterday day range averange (silver line)
- yesterday low (black line)
- average between yesterday high and yesterday average, together with a resistance range (red)
- average between yesterday low and yesterday average, together with a support range (green)
- two extension ranges above yesterday high (first is blue, second is red)
- two extension ranges below yesterday low (first is blue, second is green)
Trading levels is one of most effective trading tecniques:
- once a level is broken upwards, you can long (buy) the bullish retest with stoploss below recent low
- once a level is broken downwards, you can short (sell) the bearish retest with stoploss below recent high
- consolidation below or at a resistance level is bullish, so long (buy) breakout upwards and long more on a bullish retest of broken level
- consolidation above or at a support level is bearish, so short (sell) breakout downwards and short more on a bearish retest of broken level
- many times you see a level to be tested 2 or 3 times: short (sell) double and triple top, long (buy) double or triple bottom
Here you can see the levels described above and basic usage in a consolidation trading day:
A trader who wants to be a winner must understand that money and risk management are very important, so manage your position size and always have a stop loss in your trades.
Here you can see many examples on how to use this indicator.
Triple top on yesterday range high: perfect short setup (5 take profits targets in the example)
Resistance levels broken: long setup on bullish retest (2 take profits targets in the example)
Double top and support broken: 2 short setups (2 and 3 take profits targets in the example)
Here some examples how to basically use the indicator in a consolidation trading day: short (sell) resistance levels, long (buy) support levels
This is a premium indicator, so send me a private message in order to get access to this script.
招待専用スクリプト
このスクリプトは作者が承認したユーザーのみアクセス可能です。使用するにはアクセス申請をして許可を得る必要があります。通常は支払い後に承認されます。詳細は下記の作者の指示に従うか、astroparkに直接お問い合わせください。
TradingViewは、作者を完全に信頼し、スクリプトの動作を理解していない限り、有料スクリプトの購入・使用を推奨しません。コミュニティスクリプトには無料のオープンソースの代替が多数あります。
作者の指示
I'm a software engineer, passionate for trading & developing trading tools & bots! Feel free to DM me & checkout my work: bit.ly/astroparktrading
免責事項
この情報および投稿は、TradingViewが提供または推奨する金融、投資、トレード、その他のアドバイスや推奨を意図するものではなく、それらを構成するものでもありません。詳細は利用規約をご覧ください。