INVITE-ONLY SCRIPT
Hershey's CoCo part 2
This is my variation of the Correlation Coefficient and I call it "Hershey's CoCo". The indicator identifies very specific Stock, Sector and Market pressures on whatever symbol you are evaluating.
If interested, follow me and send me requests to evaluate your stock or sector as I refine this tool.
***********************************************
Now we'll look at some chart examples...
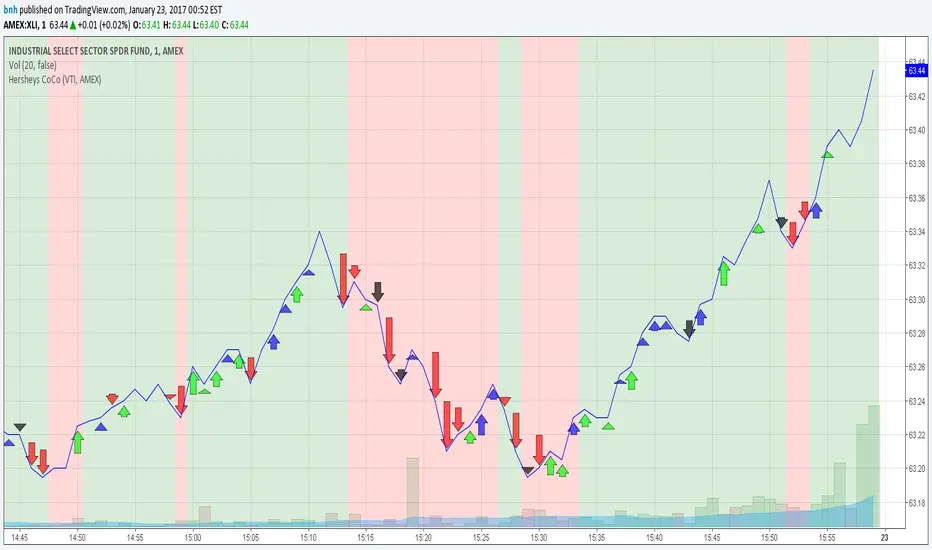
The first long red arrow tells us both the stock and sector are dropping and the sector is down more than the stock. So the next three are red as well and are DECREASING in size, approaching the end of that sector pressure and a reversal in price. You'll see this often where arrow length predicts reversals.
Sample1
This stock is rising with a long series of mostly green, then gets hit with some large BLACK arrows, which is purely stock pressure.. so much pressure even the couple green arrows could not stop the slide.
Sample2
Look at the momentum of those huge blue bars... decreasing blue arrow lengths at the end of the rally and then confirmed with some profit taking black bars at the end.
Sample3
Consecutive and larger blue bars clearly tell this story.
Sample4
Black and red dominate.
Sample5
I brought up this stock after someone told me they caught some of the ride. This sample has a Stock/Sector CoCo on the left and a Sector/Market CoCo on the right. CoCo should really shine following large gaps.
Sample6
***********************************************
Here are two charts that show how to identify sectors that are gaining independent price movement... both are showing sector charts from the previous week.
This is comparing the Industrial Sector to Market. The background colors are an average of all arrow differences, so it is clearly showing sector momentum as the week progresses.
Sample7
Showing the Healthcare sector and confirming independent and growing weakness compared to the market.
Sample8
***********************************************
Using Hershey's CoCo...
- During trading hours, with 1 minute ticks, you'll clearly know which container drove the larger price movements, be it the Stock, the Sector or the Market.
- This is an important point about the information this tool gives you. If you see a stock price pattern emerging in front of you that can be attributed to the Sector or Market and NOT the Stock itself, confidence in that pattern should drop. I recently saw the completion of the right side of a cup formation that clearly came from the sector. Knowing if a price formation is driven by the large institutional buyers that have your stock on THEIR screens is very useful!
Good trading, and feel free to message with any questions or comments,
Brian Hershey
Here are the S&P SPDR Sector Fund symbols if you wish to import them into a new TradingView Watchlist...
AMEX:XLB,AMEX:XLE,AMEX:XLF,AMEX:XLI,AMEX:XLK,AMEX:XLP,AMEX:XLRE,AMEX:XLU,AMEX:XLV,AMEX:XLY,AMEX:XTN
If interested, follow me and send me requests to evaluate your stock or sector as I refine this tool.
***********************************************
Now we'll look at some chart examples...
The first long red arrow tells us both the stock and sector are dropping and the sector is down more than the stock. So the next three are red as well and are DECREASING in size, approaching the end of that sector pressure and a reversal in price. You'll see this often where arrow length predicts reversals.
Sample1
This stock is rising with a long series of mostly green, then gets hit with some large BLACK arrows, which is purely stock pressure.. so much pressure even the couple green arrows could not stop the slide.
Sample2
Look at the momentum of those huge blue bars... decreasing blue arrow lengths at the end of the rally and then confirmed with some profit taking black bars at the end.
Sample3
Consecutive and larger blue bars clearly tell this story.
Sample4
Black and red dominate.
Sample5
I brought up this stock after someone told me they caught some of the ride. This sample has a Stock/Sector CoCo on the left and a Sector/Market CoCo on the right. CoCo should really shine following large gaps.
Sample6
***********************************************
Here are two charts that show how to identify sectors that are gaining independent price movement... both are showing sector charts from the previous week.
This is comparing the Industrial Sector to Market. The background colors are an average of all arrow differences, so it is clearly showing sector momentum as the week progresses.
Sample7
Showing the Healthcare sector and confirming independent and growing weakness compared to the market.
Sample8
***********************************************
Using Hershey's CoCo...
- During trading hours, with 1 minute ticks, you'll clearly know which container drove the larger price movements, be it the Stock, the Sector or the Market.
- This is an important point about the information this tool gives you. If you see a stock price pattern emerging in front of you that can be attributed to the Sector or Market and NOT the Stock itself, confidence in that pattern should drop. I recently saw the completion of the right side of a cup formation that clearly came from the sector. Knowing if a price formation is driven by the large institutional buyers that have your stock on THEIR screens is very useful!
Good trading, and feel free to message with any questions or comments,
Brian Hershey
Here are the S&P SPDR Sector Fund symbols if you wish to import them into a new TradingView Watchlist...
AMEX:XLB,AMEX:XLE,AMEX:XLF,AMEX:XLI,AMEX:XLK,AMEX:XLP,AMEX:XLRE,AMEX:XLU,AMEX:XLV,AMEX:XLY,AMEX:XTN
招待専用スクリプト
このスクリプトは作者が承認したユーザーのみアクセス可能です。使用するにはアクセス申請をして許可を得る必要があります。通常は支払い後に承認されます。詳細は下記の作者の指示に従うか、bnhに直接お問い合わせください。
TradingViewは、作者を完全に信頼し、スクリプトの動作を理解していない限り、有料スクリプトの購入・使用を推奨しません。コミュニティスクリプトには無料のオープンソースの代替が多数あります。
作者の指示
免責事項
この情報および投稿は、TradingViewが提供または推奨する金融、投資、トレード、その他のアドバイスや推奨を意図するものではなく、それらを構成するものでもありません。詳細は利用規約をご覧ください。