PROTECTED SOURCE SCRIPT
Mansfield Relative Strength Multi Trend
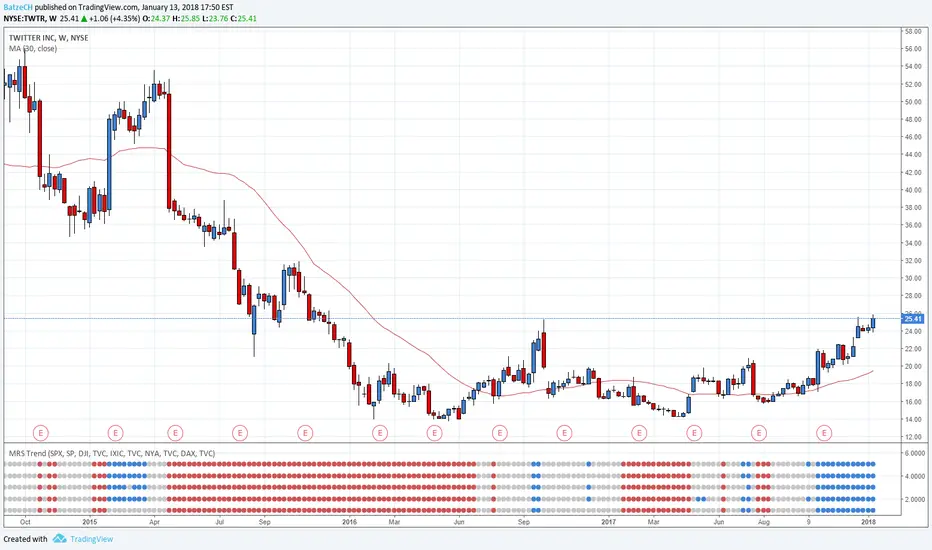
This indicator is an advanced studie of 'Mansfield Relative Strength Trend' indicator

Since it is too time consuming to constantly change the index, I have developed a multi-index indicator.
The default order of the indexes is:
1. S&P 500
2. Dow Jones Industrial Average
3. Nasdaq Composite
4. NYSE Composite
5. DAX
You can change all indexes in the settings if you want.
*********************************
'Stan Weinstein' developed an indicator called Relative Strength which compares the relative strength of a stock with the associated index.
This indicator combines the relative strength with Weinstein's stage analysis.
The indiacator was made for weekly stock charts only!
BUY & HOLD Conditions (green):
1. Mansfield Relative Strength is above the zero line
2. Price is above the Simple Moving Average (30)
3. Simple Moving Average (30) is rising
SELL & HOLD Conditions (red):
1. Mansfield Relative Strength is below the zero line
2. Price is below the Simple Moving Average (30)
3. Simple Moving Average (30) is falling
It is recommended to end the trade when the trend changes.
*********************************
Please always remember, there is no holy grail indicator!
保護スクリプト
このスクリプトのソースコードは非公開で投稿されています。 ただし、制限なく自由に使用できます – 詳細はこちらでご確認ください。
免責事項
この情報および投稿は、TradingViewが提供または推奨する金融、投資、トレード、その他のアドバイスや推奨を意図するものではなく、それらを構成するものでもありません。詳細は利用規約をご覧ください。
免責事項
この情報および投稿は、TradingViewが提供または推奨する金融、投資、トレード、その他のアドバイスや推奨を意図するものではなく、それらを構成するものでもありません。詳細は利用規約をご覧ください。