INVITE-ONLY SCRIPT
TIL Trend Navigator
Trading Indicator Lab’s Trend Navigator for TradingView is an indicator that can help you reveal the underlying trends in any chart on any timeframe.
Determining Trends
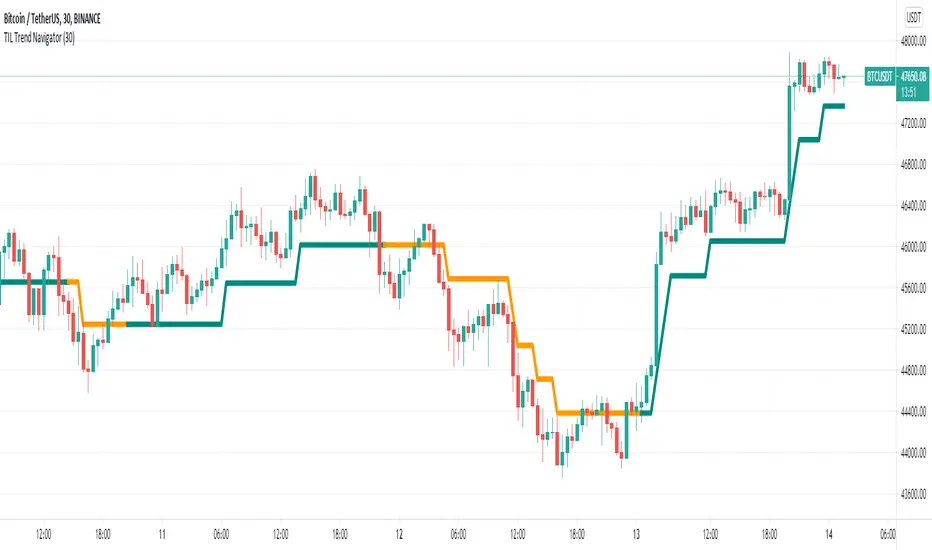
It only takes a minute or two to analyze the indicator with its simple yet insightful methods of representing bullish, bearish and ranging price action across the chart. It forms a single line that runs in 3 directions:
- Upward direction – represents a significant bullish price action
- Horizontal direction – represents ranging price action or consolidation
- Downward direction – represents a significant bearish price action
The indicator borrows the concept of Renko charts where upward and downward price action are shown to move at a single identical angle. This makes the indicator more intuitive and easier to read.
Support and Resistance
That’s not all. The Trend Navigator can also serve as a support or resistance line at any given point in the bar history. This is distinguished with the dual colors of the lines which alternates at each segment:
- Support segment (green) – the segment acts as support where price moves above the line
- Resistance segment (orange) – the segment acts as resistance where price moves below the line
Breakouts occur when the bar crosses above or below the Trend Navigator, at which point, its line changes color to signal the change of its role as a support or resistance level.
Available Alert Conditions
- Cross – triggers when price crosses the Trend Navigator
- Soar – triggers when majority of the bar’s body crosses above the Trend Navigator
- Plummet – triggers when majority of the bar’s body crosses below the Trend Navigator
- Uptrend – triggers when a new uptrend is detected
- Downtrend – triggers when a new downtrend is detected
- Ranging – triggers when a new ranging price action is detected
- Trend Reversal – triggers when either an uptrend or downtrend is detected
Inputs
- Length – sets the number of bars the indicator analyzes at each execution
- Support Segment Color – allows the user to change the color of the support segments. Its default color is green
- Resistance Segment Color – allows the user to change the color of the resistance segments. Its default color is orange
Determining Trends
It only takes a minute or two to analyze the indicator with its simple yet insightful methods of representing bullish, bearish and ranging price action across the chart. It forms a single line that runs in 3 directions:
- Upward direction – represents a significant bullish price action
- Horizontal direction – represents ranging price action or consolidation
- Downward direction – represents a significant bearish price action
The indicator borrows the concept of Renko charts where upward and downward price action are shown to move at a single identical angle. This makes the indicator more intuitive and easier to read.
Support and Resistance
That’s not all. The Trend Navigator can also serve as a support or resistance line at any given point in the bar history. This is distinguished with the dual colors of the lines which alternates at each segment:
- Support segment (green) – the segment acts as support where price moves above the line
- Resistance segment (orange) – the segment acts as resistance where price moves below the line
Breakouts occur when the bar crosses above or below the Trend Navigator, at which point, its line changes color to signal the change of its role as a support or resistance level.
Available Alert Conditions
- Cross – triggers when price crosses the Trend Navigator
- Soar – triggers when majority of the bar’s body crosses above the Trend Navigator
- Plummet – triggers when majority of the bar’s body crosses below the Trend Navigator
- Uptrend – triggers when a new uptrend is detected
- Downtrend – triggers when a new downtrend is detected
- Ranging – triggers when a new ranging price action is detected
- Trend Reversal – triggers when either an uptrend or downtrend is detected
Inputs
- Length – sets the number of bars the indicator analyzes at each execution
- Support Segment Color – allows the user to change the color of the support segments. Its default color is green
- Resistance Segment Color – allows the user to change the color of the resistance segments. Its default color is orange
招待専用スクリプト
このスクリプトは作者が承認したユーザーのみアクセス可能です。使用するにはアクセス申請をして許可を得る必要があります。通常は支払い後に承認されます。詳細は下記の作者の指示に従うか、tradingindicatorlabに直接お問い合わせください。
TradingViewは、作者を完全に信頼し、スクリプトの動作を理解していない限り、有料スクリプトの購入・使用を推奨しません。コミュニティスクリプトには無料のオープンソースの代替が多数あります。
作者の指示
Please feel free to send us a private message here on TradingView to gain access to this indicator.
免責事項
この情報および投稿は、TradingViewが提供または推奨する金融、投資、トレード、その他のアドバイスや推奨を意図するものではなく、それらを構成するものでもありません。詳細は利用規約をご覧ください。