INVITE-ONLY SCRIPT
Pipnotic Asset Strength Histogram
Description
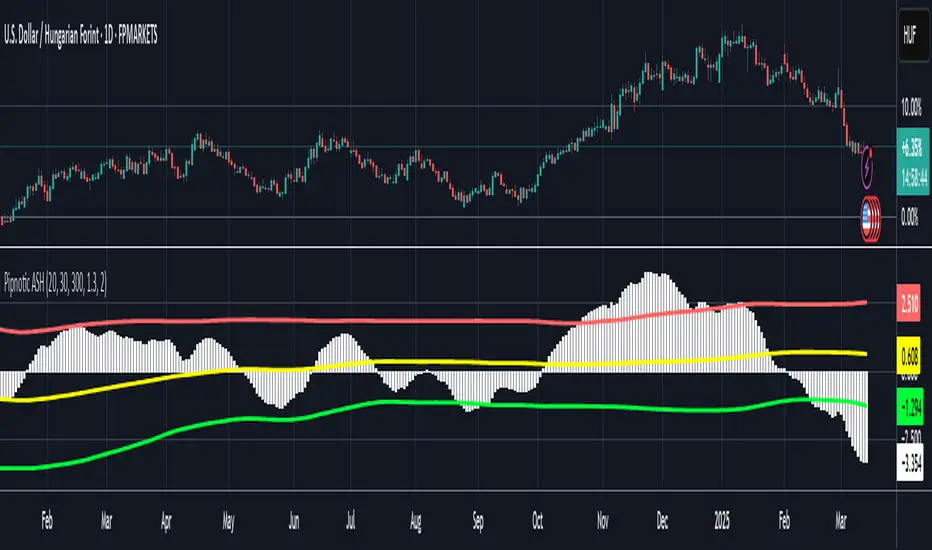
The Pipnotic Asset Strength Histogram (ASH) was originally developed to provide traders with a structured approach to identifying market cycles and momentum shifts. Due to increasing demand, it has been adapted for TradingView, ensuring traders can leverage its insights directly on their charts. This tool is particularly useful for spotting divergences, trend reversals, and price imbalances, making it an essential addition for traders who rely on momentum and strength-based analysis. We will continue to actively develop this indicator to enhance its functionality and accuracy.
How It Works
The ASH follows a systematic approach to analyse price movements and highlight key market dynamics:
Momentum & Cycle Analysis
Divergence Detection
Dynamic Visualization & Alerts
Key Features & Inputs
Benefits of Using the Pipnotic ASH Indicator
Market Timing: Helps traders identify optimal entry and exit points based on momentum shifts.
Reduces Subjectivity: Automates the detection of market strength and divergence, ensuring consistency.
Adapts to Market Conditions: Adjusts dynamically to price changes, ensuring relevant signals.
Saves Time & Effort: Eliminates the need for manual divergence analysis.
Works on All Timeframes: Suitable for scalping, swing trading, and long-term investing.
The Pipnotic Asset Strength Histogram is designed to streamline market analysis by providing clear, actionable insights into momentum shifts and divergences. Whether you're a day trader or a long-term investor, this tool helps refine your decision-making and enhance your trading strategy.
The Pipnotic Asset Strength Histogram (ASH) was originally developed to provide traders with a structured approach to identifying market cycles and momentum shifts. Due to increasing demand, it has been adapted for TradingView, ensuring traders can leverage its insights directly on their charts. This tool is particularly useful for spotting divergences, trend reversals, and price imbalances, making it an essential addition for traders who rely on momentum and strength-based analysis. We will continue to actively develop this indicator to enhance its functionality and accuracy.
How It Works
The ASH follows a systematic approach to analyse price movements and highlight key market dynamics:
Momentum & Cycle Analysis
- Evaluates price movements using a dual-smoothing methodology.
- Identifies shifts in momentum that indicate potential reversals or trend continuations.
Divergence Detection
- Highlights instances where price action diverges from underlying momentum, signalling potential trading opportunities.
- Helps confirm trade setups based on hidden and regular divergences.
Dynamic Visualization & Alerts
- Plots a histogram to provide a clear visual representation of market strength.
- Identifies buy and sell zones based on historical price deviations.
- Updates dynamically, adapting to changing market conditions to maintain relevance.
Key Features & Inputs
- Customizable Sensitivity: Traders can fine-tune cycle smoothing values to match different trading styles.
- Clear Buy & Sell Zones: Highlights potential high-probability trading areas based on historical deviations.
- Flexible Visualization: Adjustable histogram colours, line width, and mean deviation settings for optimal clarity.
- Adaptability Across Markets: Works effectively on stocks, forex, crypto, and commodities.
- Compatible with Various Trading Strategies: Can be used alongside trend-following, breakout, and reversal strategies for enhanced trade confirmation.
Benefits of Using the Pipnotic ASH Indicator
Market Timing: Helps traders identify optimal entry and exit points based on momentum shifts.
Reduces Subjectivity: Automates the detection of market strength and divergence, ensuring consistency.
Adapts to Market Conditions: Adjusts dynamically to price changes, ensuring relevant signals.
Saves Time & Effort: Eliminates the need for manual divergence analysis.
Works on All Timeframes: Suitable for scalping, swing trading, and long-term investing.
The Pipnotic Asset Strength Histogram is designed to streamline market analysis by providing clear, actionable insights into momentum shifts and divergences. Whether you're a day trader or a long-term investor, this tool helps refine your decision-making and enhance your trading strategy.
招待専用スクリプト
このスクリプトは作者が承認したユーザーのみアクセス可能です。使用するにはアクセス申請をして許可を得る必要があります。通常は支払い後に承認されます。詳細は下記の作者の指示に従うか、pipnoticに直接お問い合わせください。
TradingViewは、作者を完全に信頼し、スクリプトの動作を理解していない限り、有料スクリプトの購入・使用を推奨しません。コミュニティスクリプトには無料のオープンソースの代替が多数あります。
作者の指示
This script is available exclusively to Pipnotic subscribers as part of subscriptions at https://pipnotic.org/tv
免責事項
この情報および投稿は、TradingViewが提供または推奨する金融、投資、トレード、その他のアドバイスや推奨を意図するものではなく、それらを構成するものでもありません。詳細は利用規約をご覧ください。